Fig. 4.
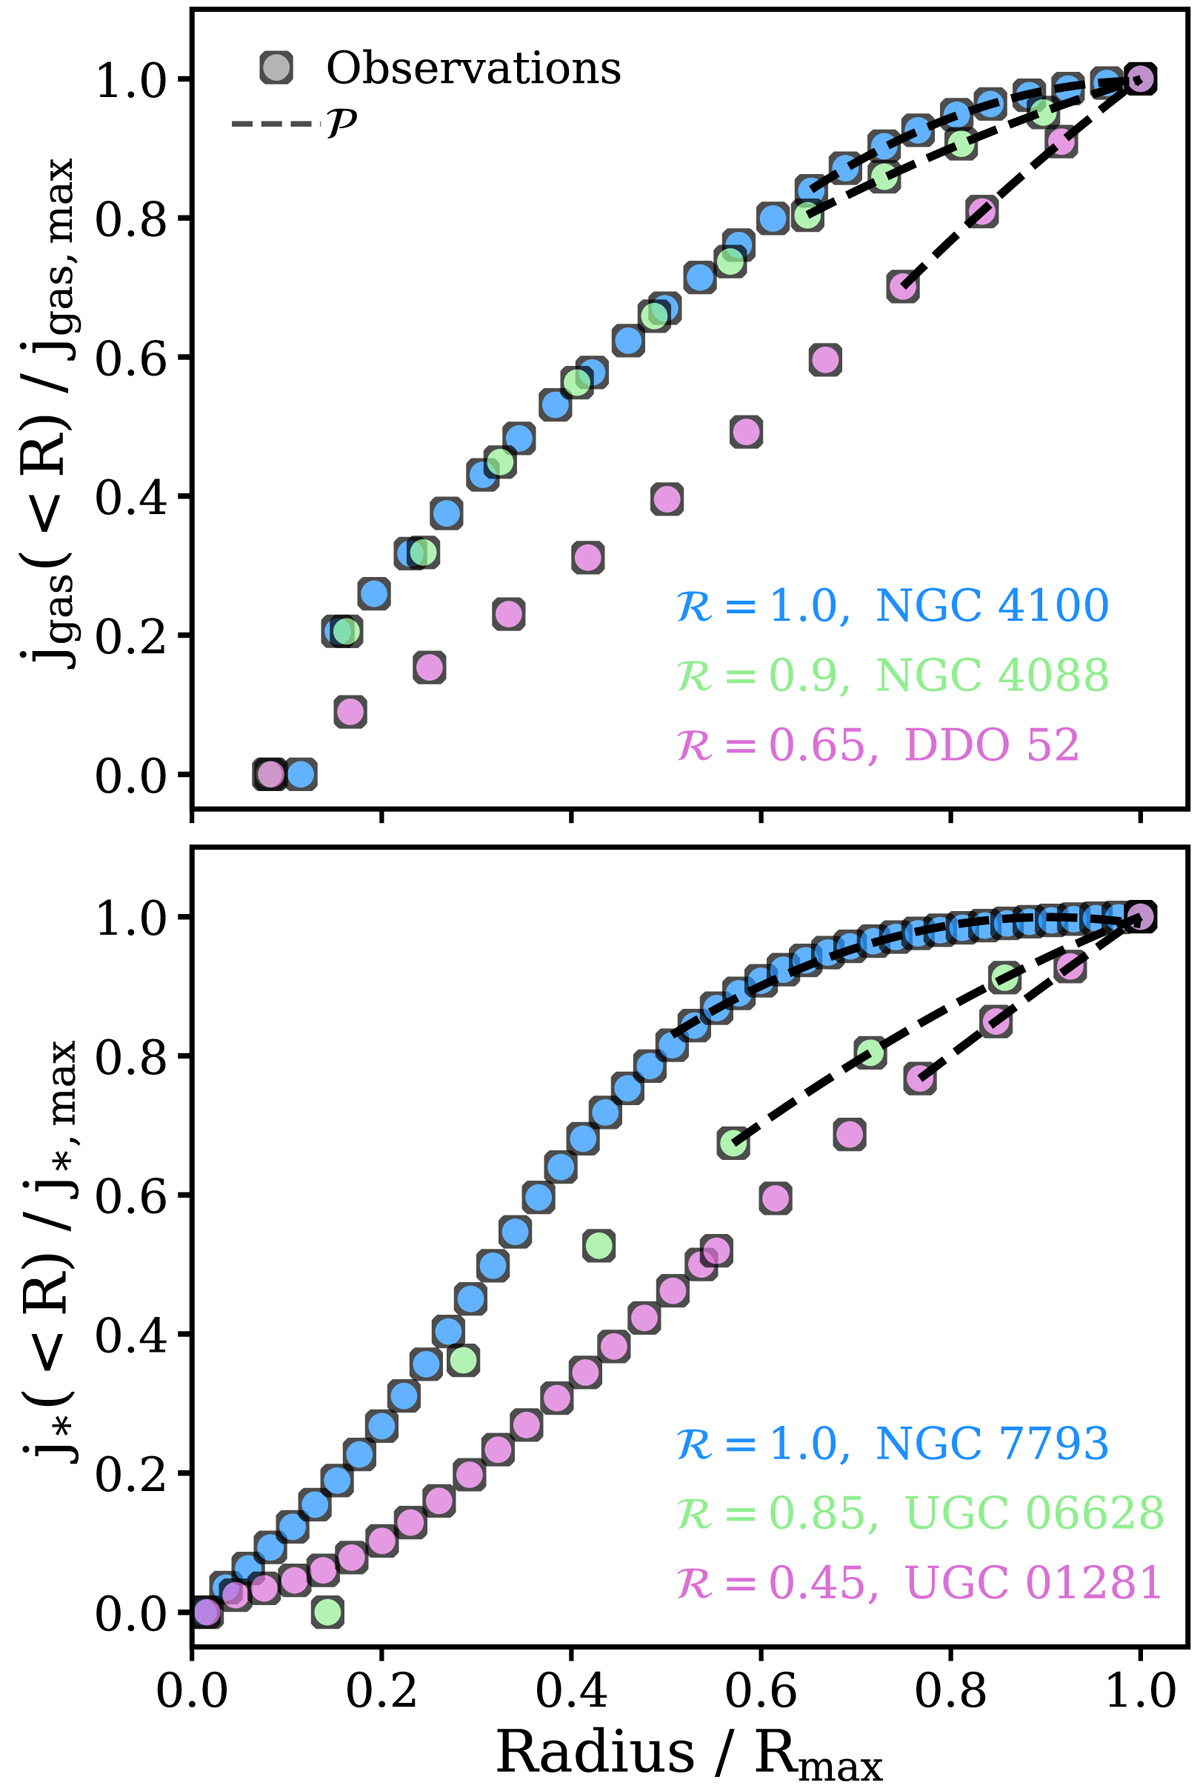
Example of representative cumulative jgas and j* profiles in our sample. The axes are normalized to allow the comparison between the profiles. The points show the observed cumulative profiles for the gas (top) and stellar (bottom) component, while the dashed lines show the fitted polynomial 𝒫 to these profiles (see text). The name of the galaxy and the value of the convergence factor ℛ for their profiles are provided. Only galaxies with ℛ ≥ 0.8 are used in our analysis. We note that, due to the normalization, the last point of all the profiles overlap with each other.
Current usage metrics show cumulative count of Article Views (full-text article views including HTML views, PDF and ePub downloads, according to the available data) and Abstracts Views on Vision4Press platform.
Data correspond to usage on the plateform after 2015. The current usage metrics is available 48-96 hours after online publication and is updated daily on week days.
Initial download of the metrics may take a while.