Fig. B.2.
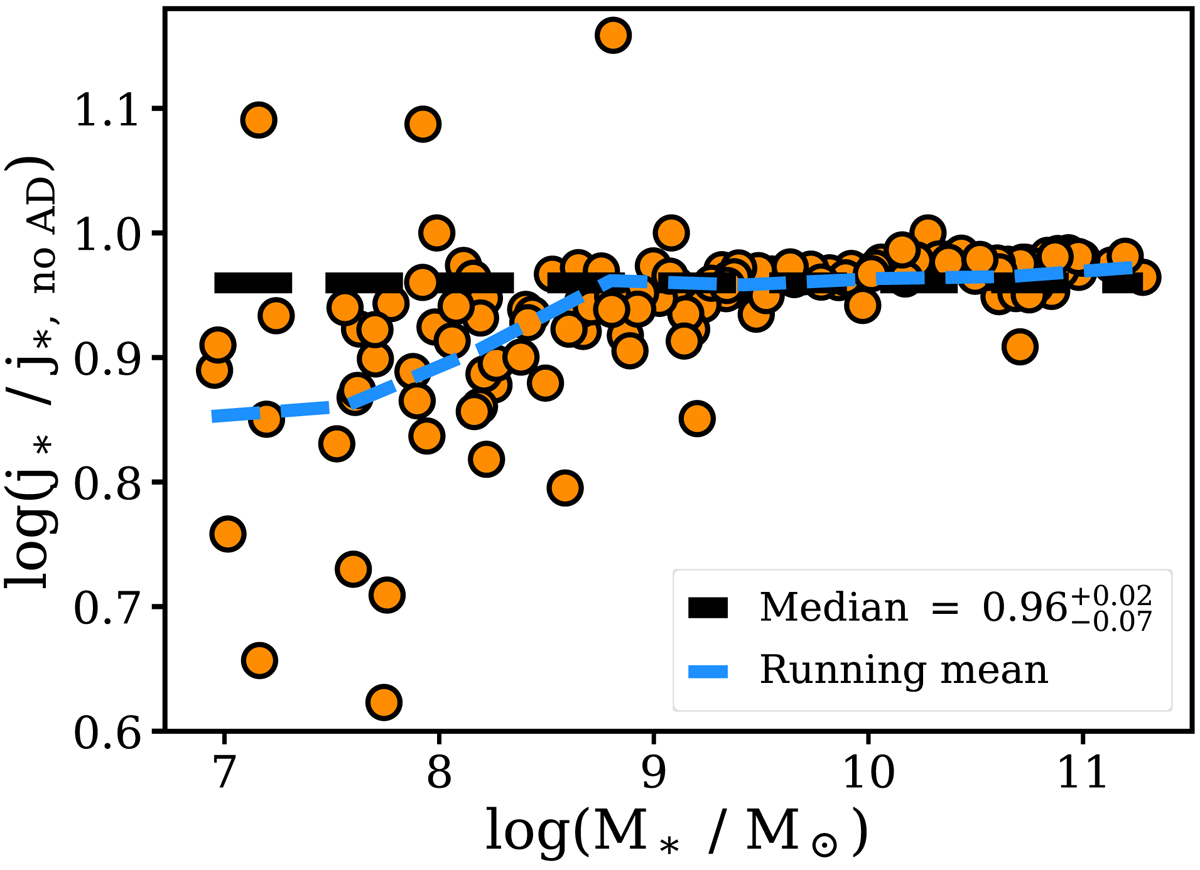
Ratio between values of the stellar specific angular moment obtained when the asymmetric drift correction is applied (j*) or not (j*, no AD), i.e. co-rotation if stars and gas is assumed, as a function of M*. Orange points show the ratios for each galaxy, while the dashed black and blue lines show the median of the distribution and the running mean, respectively. Three galaxies have a larger j* when the asymmetric drift correction is applied. This is because those galaxies have a strong contribution of pressure-supported motions, such that the stellar rotation curve derived from the circular speed profile has a larger amplitude than the H I rotation curve.
Current usage metrics show cumulative count of Article Views (full-text article views including HTML views, PDF and ePub downloads, according to the available data) and Abstracts Views on Vision4Press platform.
Data correspond to usage on the plateform after 2015. The current usage metrics is available 48-96 hours after online publication and is updated daily on week days.
Initial download of the metrics may take a while.