Fig. 8.
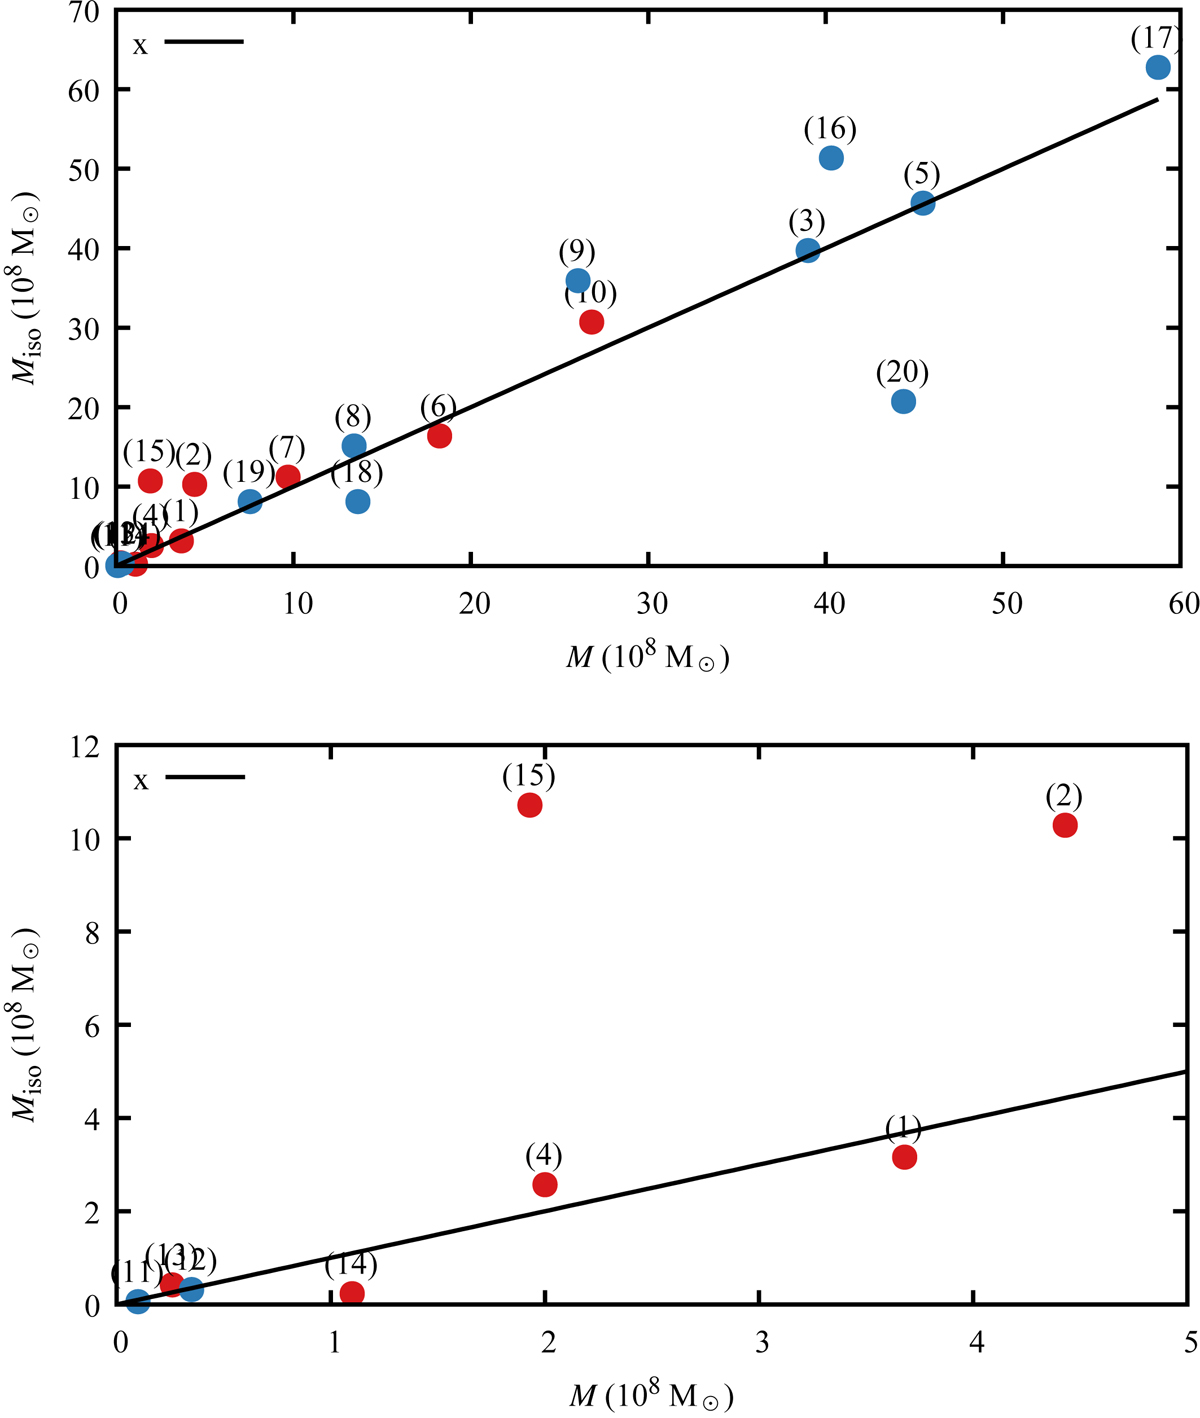
Comparison of the mass of the polytropic sphere with the mass of pseudo-isothermal model for each tested dwarf galaxy. Each point is accompanied by a number in brackets representing the dwarf galaxy (see Table 1 for the name). The cases where the polytrope model has a lower value of the χ2 test compared to the pseudo-isothermal model are depicted as red points, while the blue points indicate a better fit of the pseudo-isothermal model. The black line corresponds to the line of equality. The bottom figure is just a zoomed view of the top figure.
Current usage metrics show cumulative count of Article Views (full-text article views including HTML views, PDF and ePub downloads, according to the available data) and Abstracts Views on Vision4Press platform.
Data correspond to usage on the plateform after 2015. The current usage metrics is available 48-96 hours after online publication and is updated daily on week days.
Initial download of the metrics may take a while.