Fig. 9
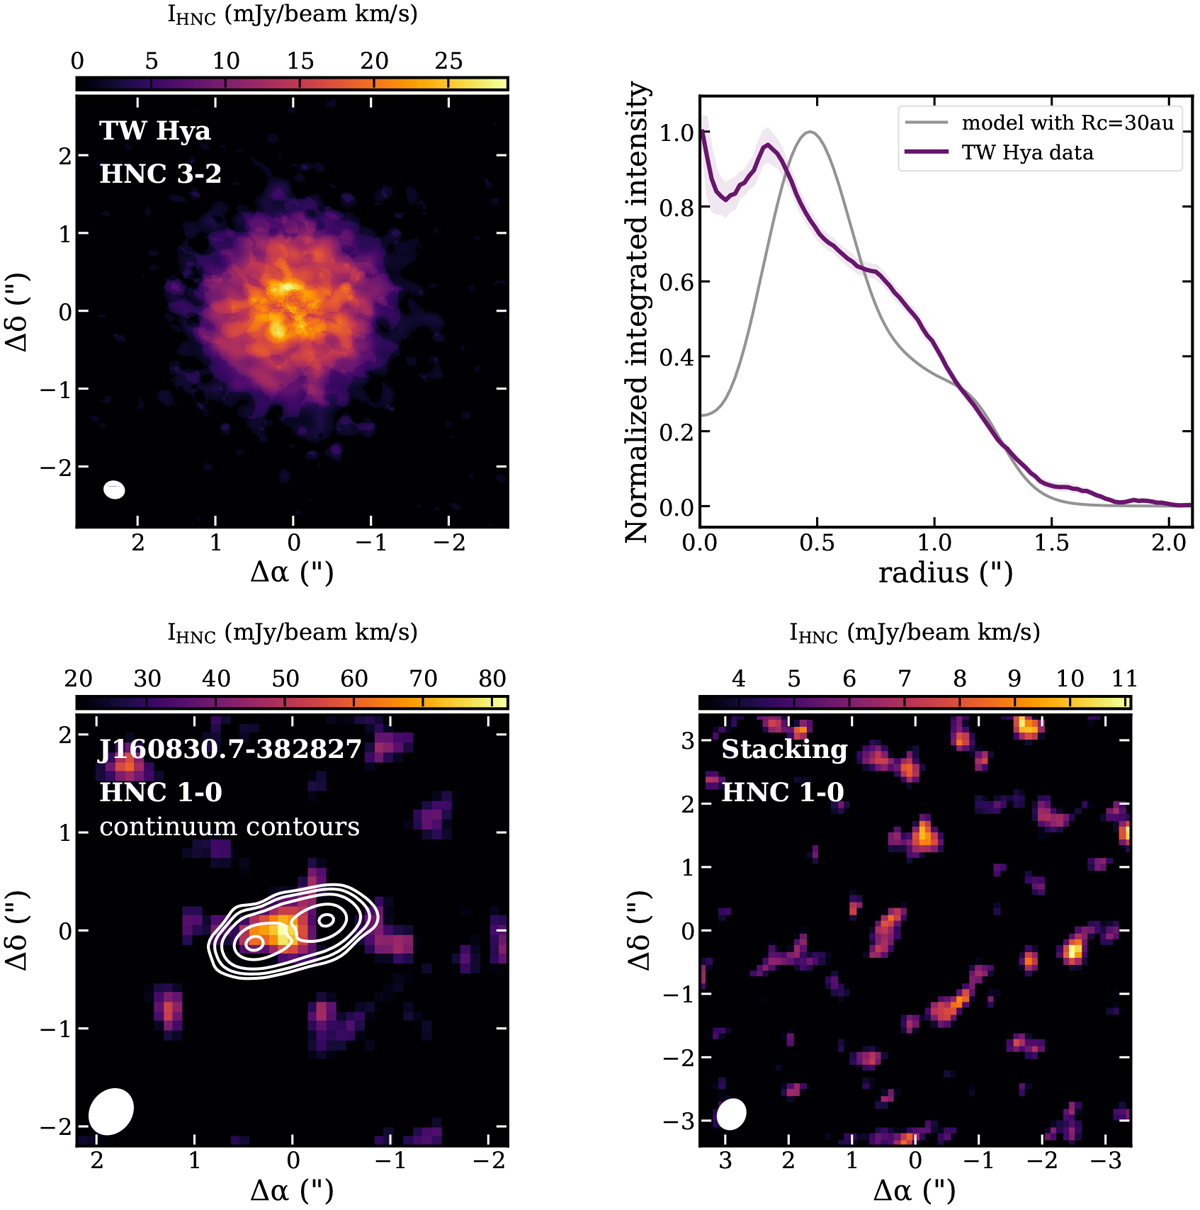
Upper panels: HNC 3−2 emission for TW Hya from ALMA observations and the deprojected azimuthally averaged (normalized) radial intensity profile for HNC emission in TW Hya (purple line). A model profile convolved with the same beam size as the ALMA observations is also shown for comparison (gray line). Lower panels: moment-zero maps for the HNC 1− 0 detection of J160830.7-382 827 and stacking results for the remaining 28 disks in the Lupus sample from ALMA observations. White contours depict the continuum emission for the transition disk J160830.7-382 827, where dust emission is absent in the disk center, while HNC 1− 0 emission mostly originates within the dust hole. The beam sizes are shown in the left corner of each panel.
Current usage metrics show cumulative count of Article Views (full-text article views including HTML views, PDF and ePub downloads, according to the available data) and Abstracts Views on Vision4Press platform.
Data correspond to usage on the plateform after 2015. The current usage metrics is available 48-96 hours after online publication and is updated daily on week days.
Initial download of the metrics may take a while.