Fig. 7
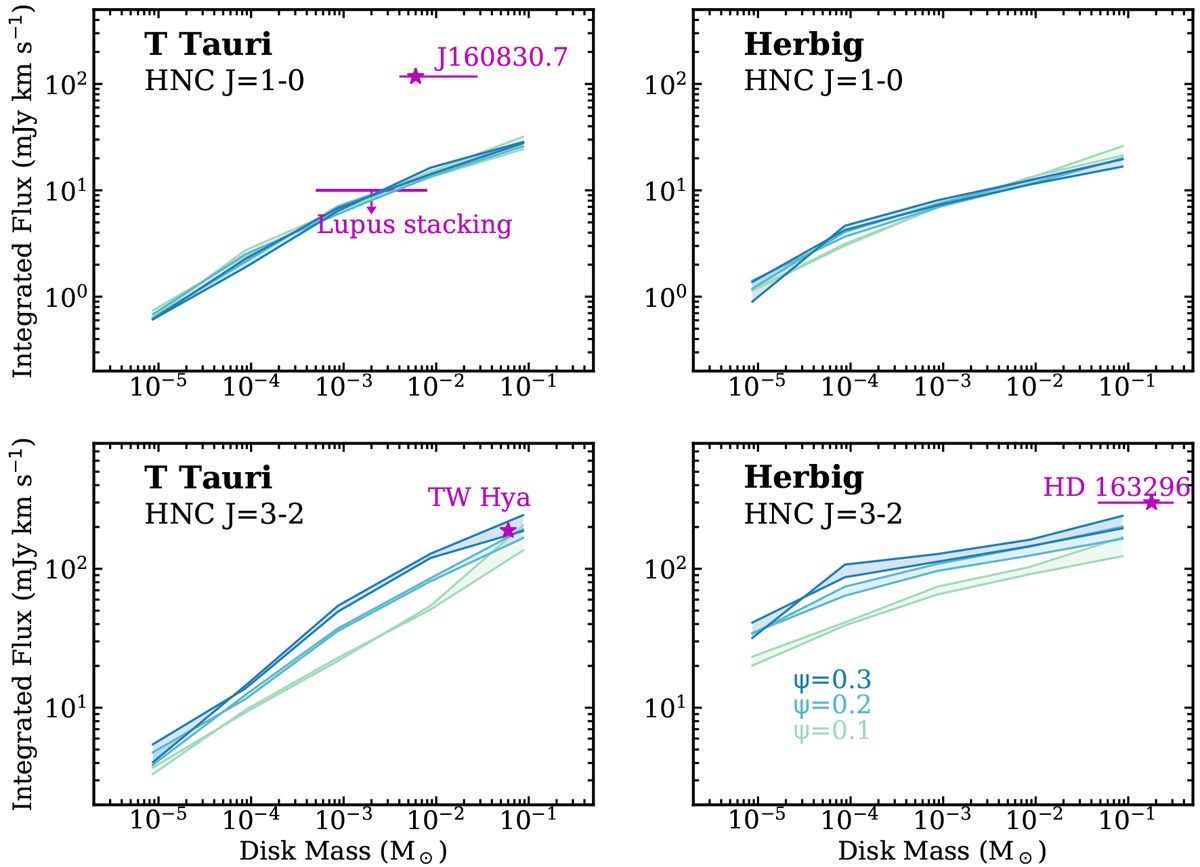
Disk-integrated line fluxes (calculated at a distance of 150 pc) of HNC as a function of disk mass (leftfor disks around T Tauri stars and right for Herbig stars). Colors represent different levels of disk flaring. Upper and lower panels are shown for different transitions. The only detection of HNC J = 1− 0 and the upper limit from stacking analysis for Lupus disks are marked for comparison. Line fluxes for TW Hya and HD 163296 are adopted from Graninger et al. (2015) and are scaled by distances.
Current usage metrics show cumulative count of Article Views (full-text article views including HTML views, PDF and ePub downloads, according to the available data) and Abstracts Views on Vision4Press platform.
Data correspond to usage on the plateform after 2015. The current usage metrics is available 48-96 hours after online publication and is updated daily on week days.
Initial download of the metrics may take a while.