Fig. 6
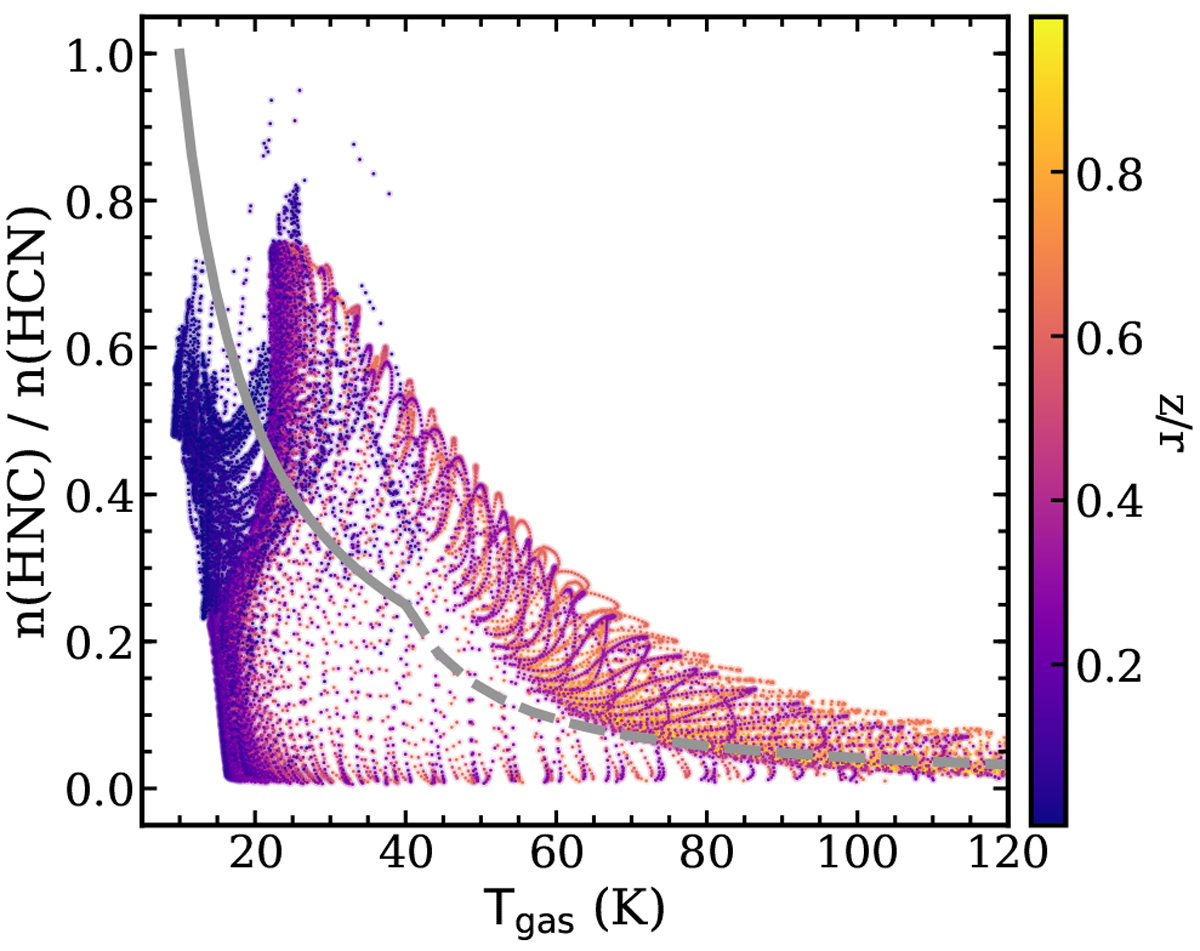
Extracted HNC and HCN abundance ratio and the corresponding gas temperature for all models with Mgas = 0.01 M⊙, color-coded by scale height z∕r. Only grids with an HNC gas number density higher than 1 × 10⁻⁵ cm−3 are selected.The line ratio–gas temperature correlations from Hacar et al. (2020) are overplotted as gray curves.
Current usage metrics show cumulative count of Article Views (full-text article views including HTML views, PDF and ePub downloads, according to the available data) and Abstracts Views on Vision4Press platform.
Data correspond to usage on the plateform after 2015. The current usage metrics is available 48-96 hours after online publication and is updated daily on week days.
Initial download of the metrics may take a while.