Fig. 5
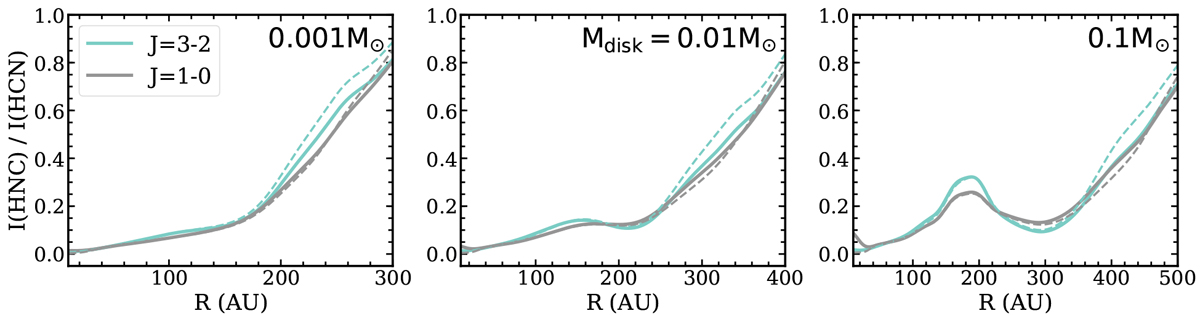
Radial profiles of HNC-to-HCN line intensity ratio for the two transitions for the Rc = 60 au models. The dashed lines are shown for the HNC-to-H13CN line ratio, reduced by a factor of 65 (the isotopic ratio), to illustrate the possible optical depth effect. Models with disk masses of 0.001, 0.01 (the fiducial model), and 0.1 M⊙ are shown from left to right.
Current usage metrics show cumulative count of Article Views (full-text article views including HTML views, PDF and ePub downloads, according to the available data) and Abstracts Views on Vision4Press platform.
Data correspond to usage on the plateform after 2015. The current usage metrics is available 48-96 hours after online publication and is updated daily on week days.
Initial download of the metrics may take a while.