Free Access
Fig. 4
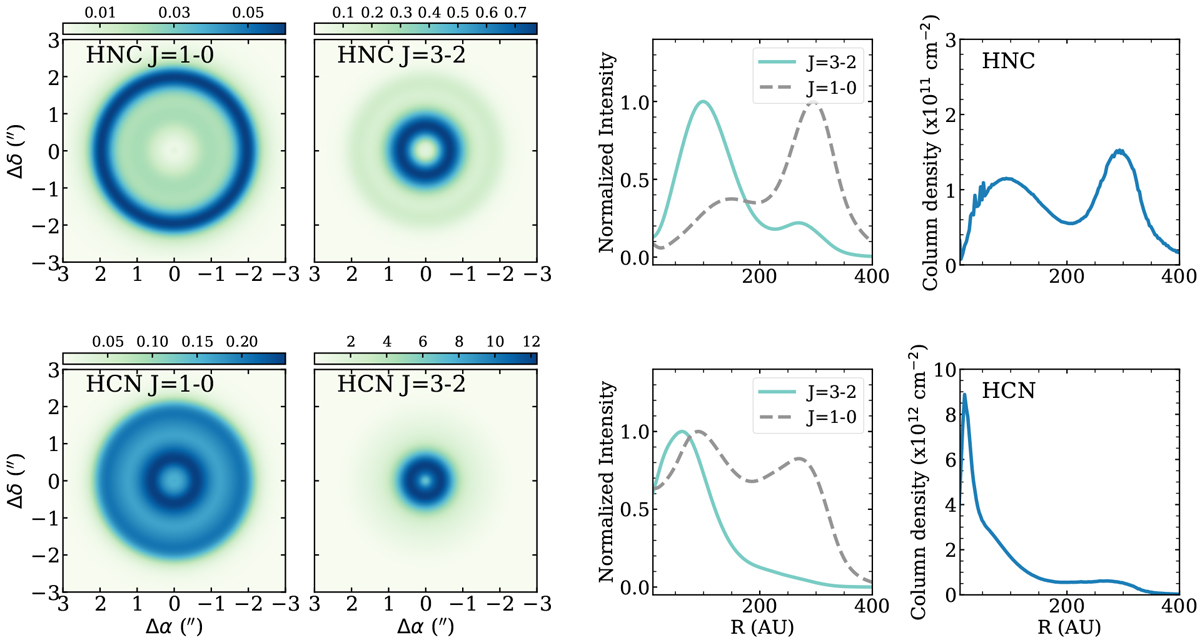
From left to right: ray-traced images, intensity profile cuts from images, and column density profile. The images are convolved with a 0.′′2 Gaussian beam in units of Jy beam−1 km s−1. Intensity profiles are normalized to the peak of each profile. A distance of 150 pc has been adopted.
Current usage metrics show cumulative count of Article Views (full-text article views including HTML views, PDF and ePub downloads, according to the available data) and Abstracts Views on Vision4Press platform.
Data correspond to usage on the plateform after 2015. The current usage metrics is available 48-96 hours after online publication and is updated daily on week days.
Initial download of the metrics may take a while.