Free Access
Fig. 3
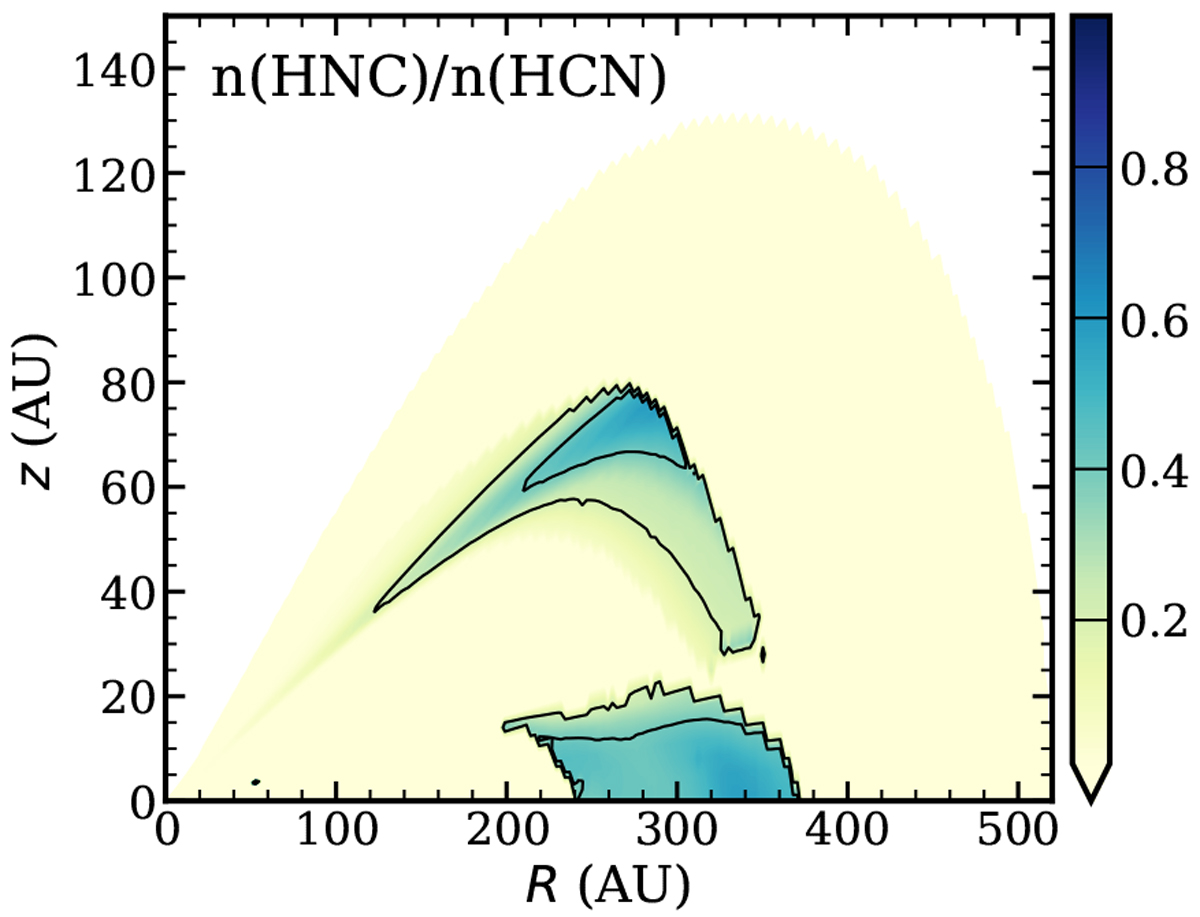
Two-dimensional profile of the HNC-to-HCN abundance ratio in the fiducial model. Only regions with HNC gas number density above 5 × 10⁻⁵ cm−3 are shown, highlighting the locations where most HNC and HCN emission is produced.
Current usage metrics show cumulative count of Article Views (full-text article views including HTML views, PDF and ePub downloads, according to the available data) and Abstracts Views on Vision4Press platform.
Data correspond to usage on the plateform after 2015. The current usage metrics is available 48-96 hours after online publication and is updated daily on week days.
Initial download of the metrics may take a while.