Free Access
Fig. E.1
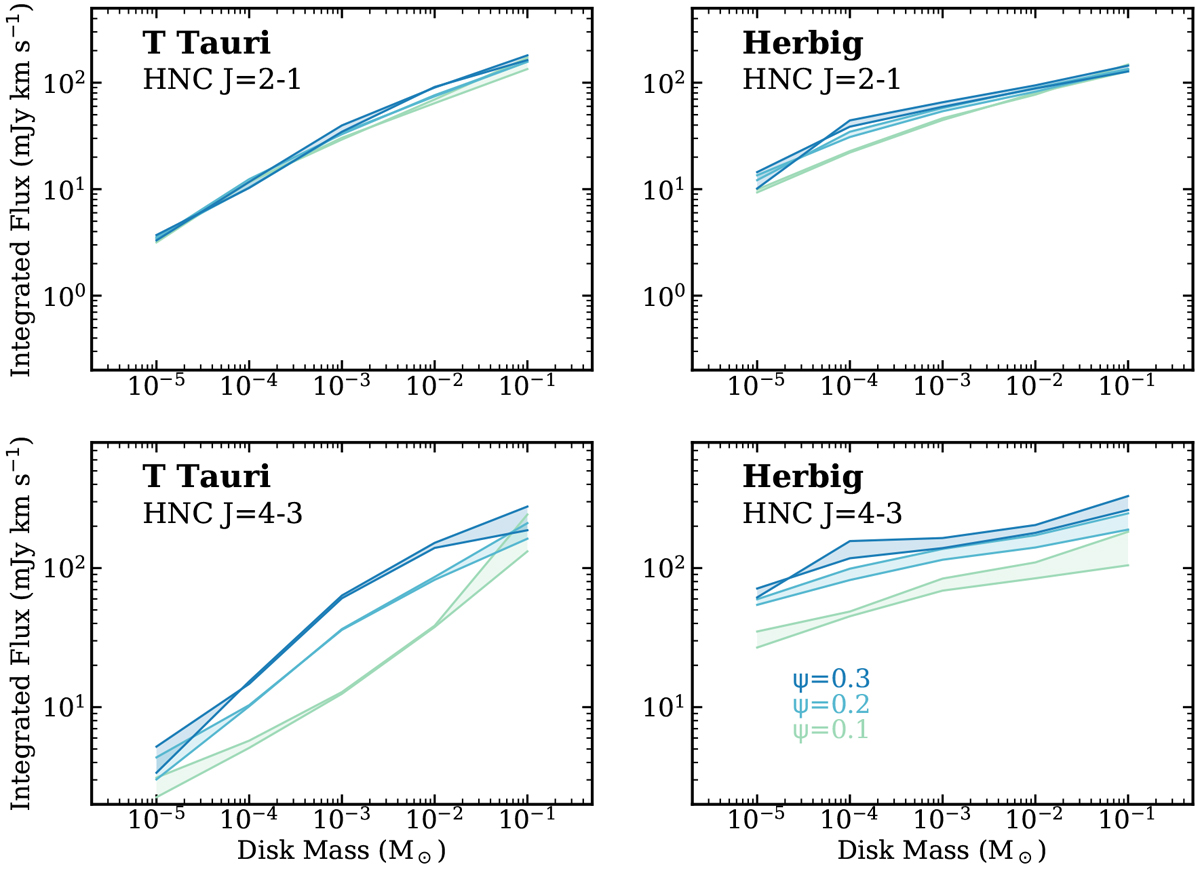
Disk-integrated line fluxes (calculated at a distance of 150 pc) of HNC J = 2− 1 and J = 4−3 as a function of disk mass (left for disks around T Tauri stars, and right for Herbig stars). Colors represent different levels of disk flaring. Upper and lower panels: different transitions.
Current usage metrics show cumulative count of Article Views (full-text article views including HTML views, PDF and ePub downloads, according to the available data) and Abstracts Views on Vision4Press platform.
Data correspond to usage on the plateform after 2015. The current usage metrics is available 48-96 hours after online publication and is updated daily on week days.
Initial download of the metrics may take a while.