Free Access
Fig. B.1
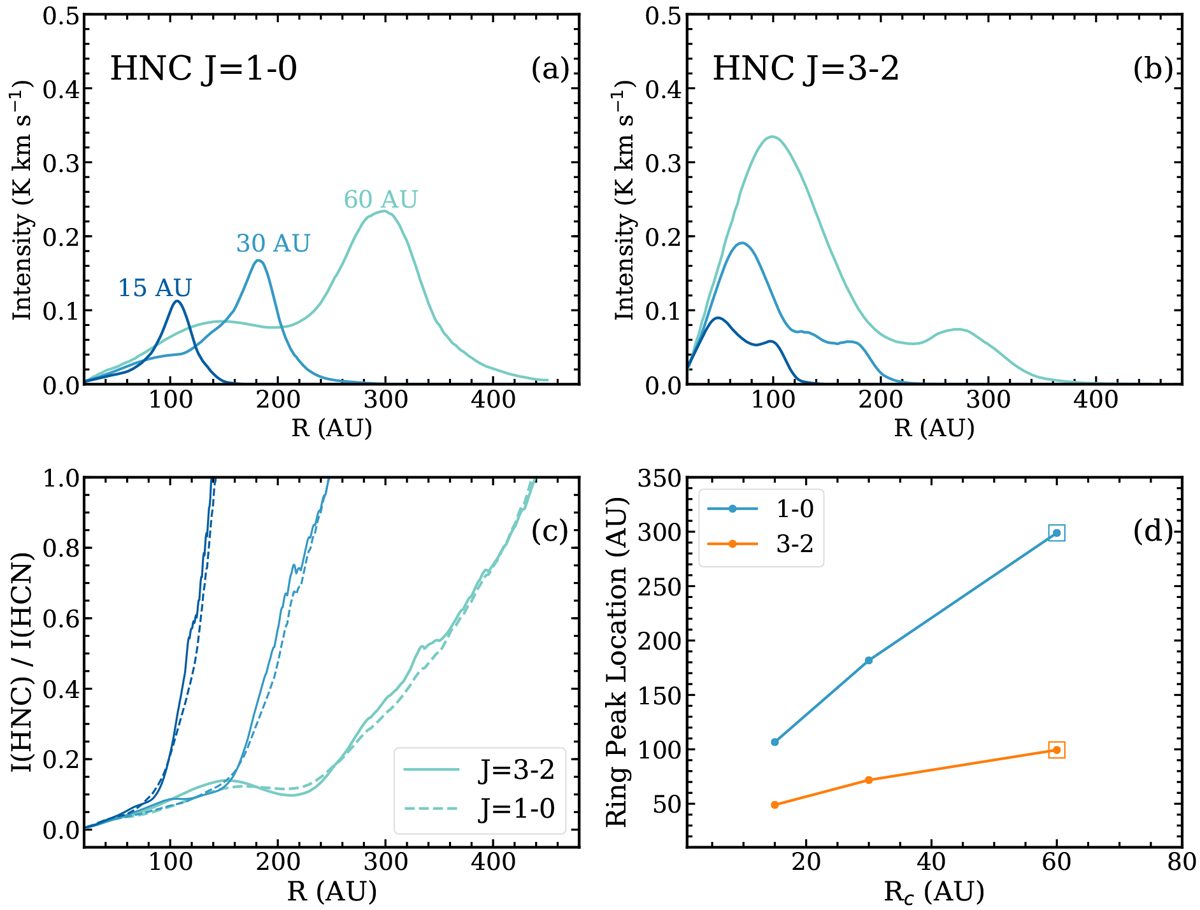
Line emission patterns in models with different Rc values (disk sizes): (a) radial intensity profiles for HNC 1−0, (b) radial intensity profiles for HNC 3−2, (c) HNC-to-HCN intensity ratio profiles, and (d) emission peak location for both transitions. The fiducial model results are marked as open squares.
Current usage metrics show cumulative count of Article Views (full-text article views including HTML views, PDF and ePub downloads, according to the available data) and Abstracts Views on Vision4Press platform.
Data correspond to usage on the plateform after 2015. The current usage metrics is available 48-96 hours after online publication and is updated daily on week days.
Initial download of the metrics may take a while.