Fig. 10
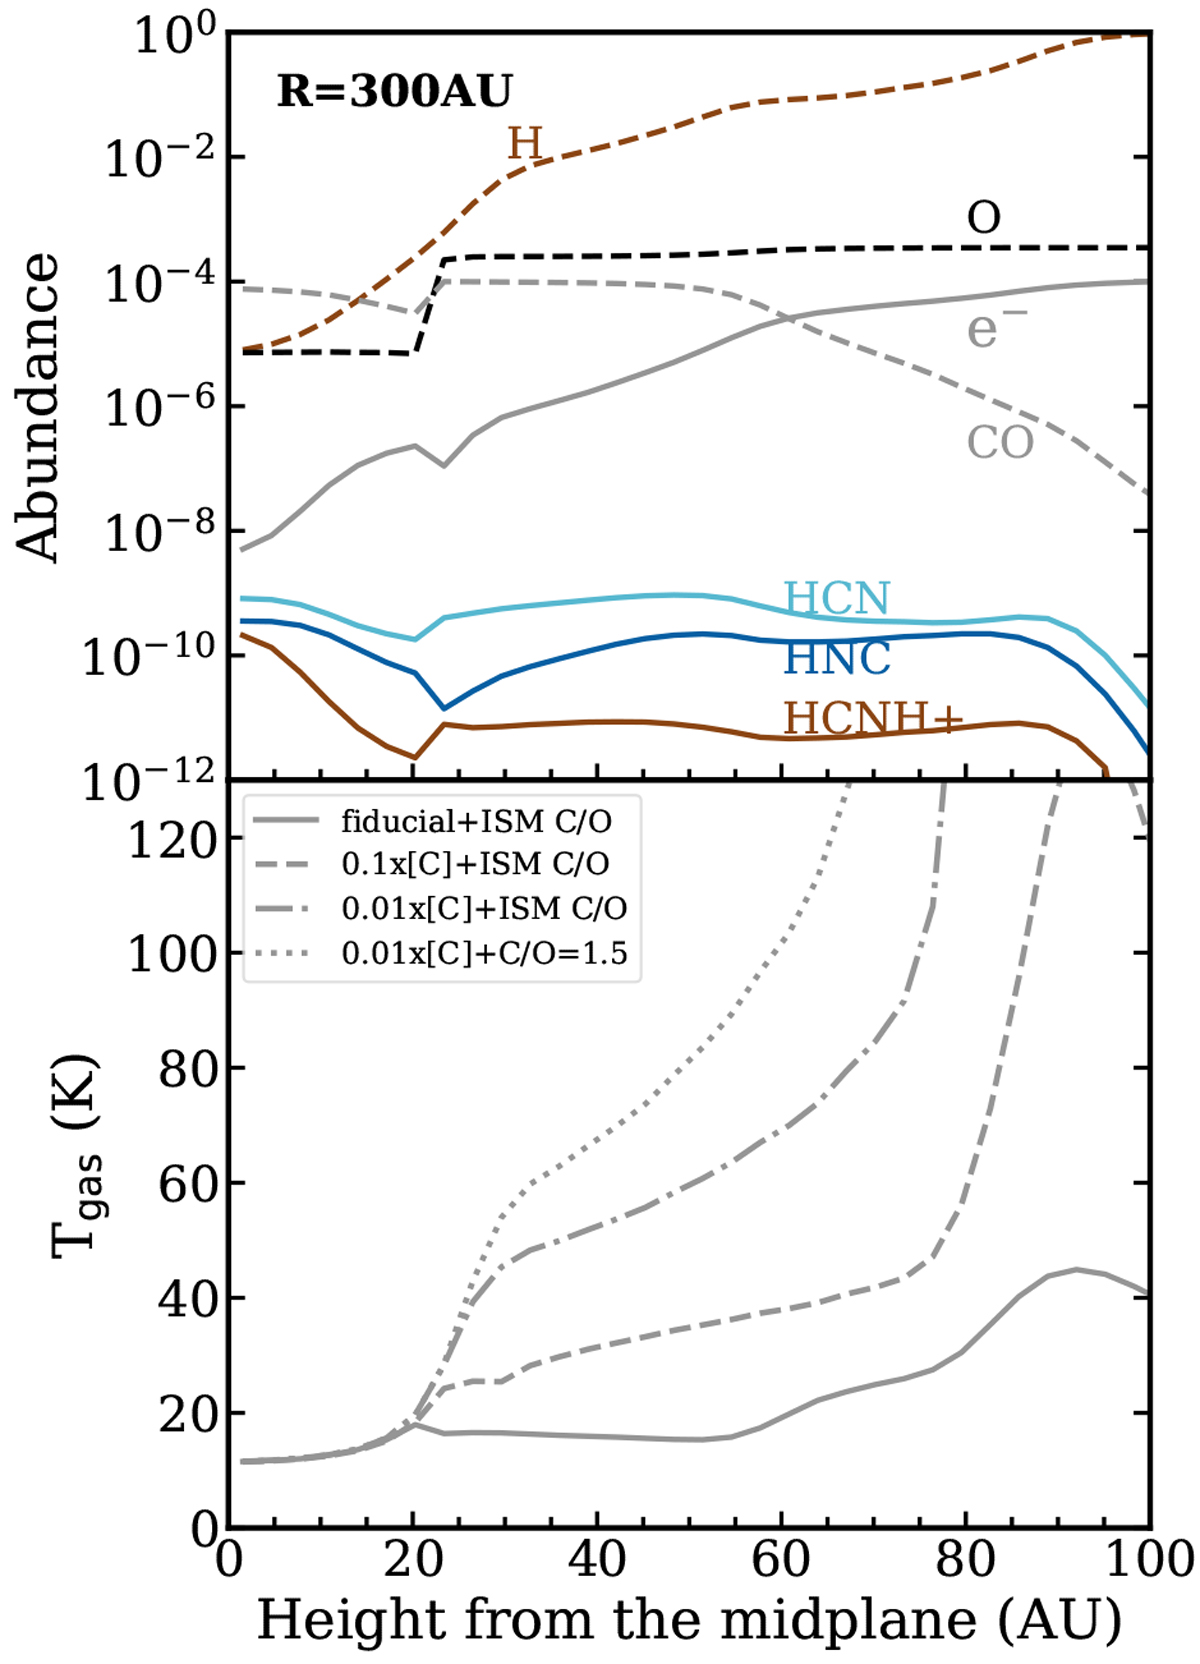
Top: abundance profiles along the vertical disk direction at the radius of 300 au for HNC and HCN in the fiducial model, as well as species relevant to their formation (HCNH+ and e−) and destruction (H and O). The drop in CO abundance in the top layer reflects where CO photodissociation becomes important. Bottom: gas temperature profile along the vertical disk direction at 300 au for the fiducial model (solid line), as comparisons to carbon and oxygen depletion models (dashed line: a factor of 10; dash-dotted line: a factor of 100; and dotted line: C/O = 1.5).
Current usage metrics show cumulative count of Article Views (full-text article views including HTML views, PDF and ePub downloads, according to the available data) and Abstracts Views on Vision4Press platform.
Data correspond to usage on the plateform after 2015. The current usage metrics is available 48-96 hours after online publication and is updated daily on week days.
Initial download of the metrics may take a while.