Fig. 9
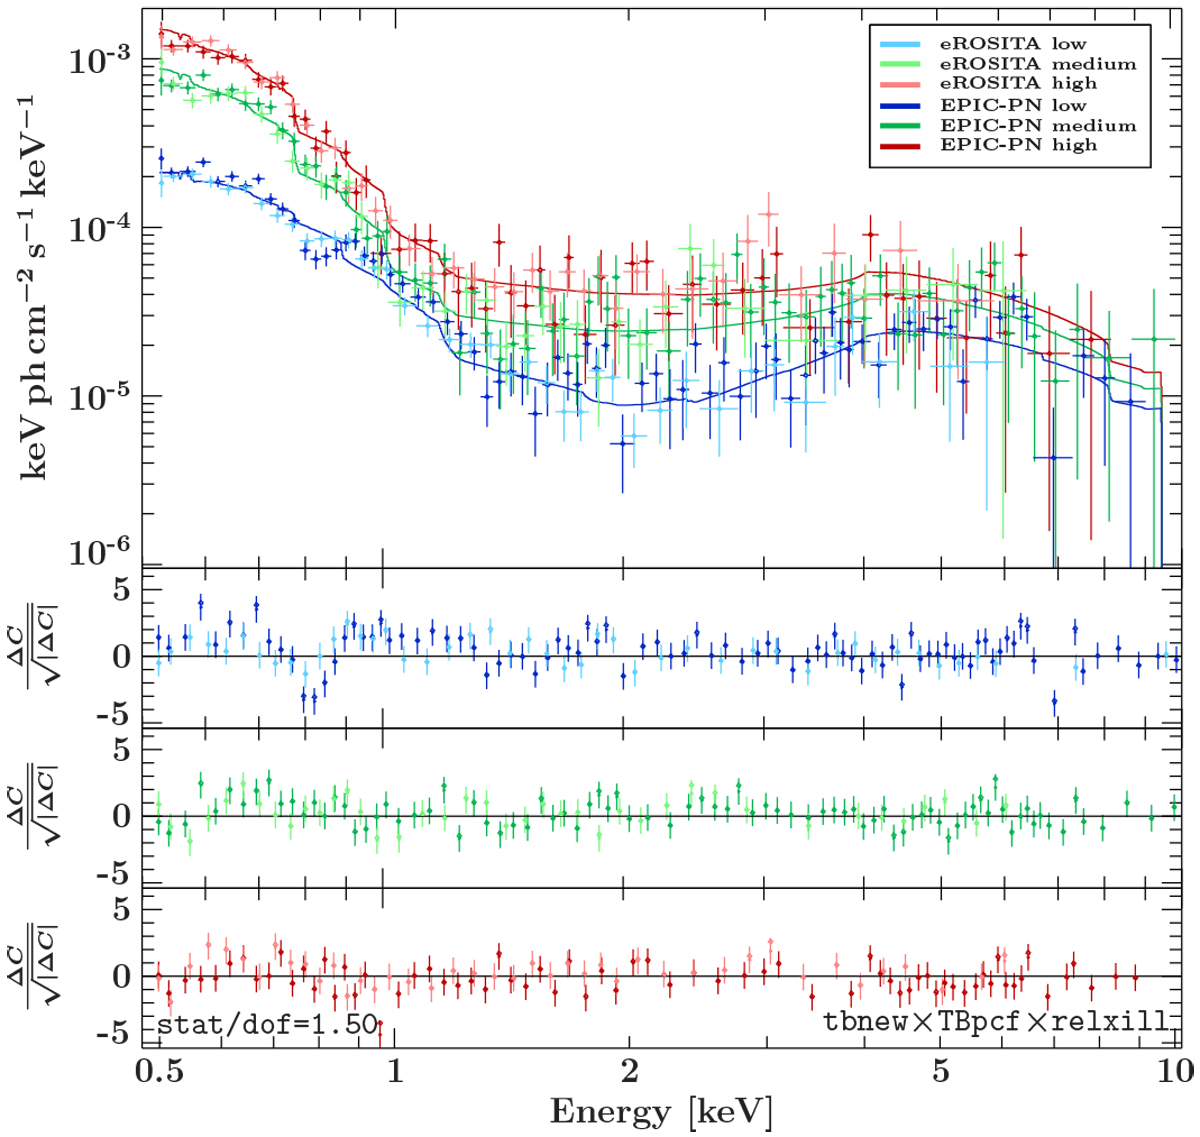
Count-rate-selected eROSITA and EPIC-pn spectra extracted from time windows highlighted in Fig. 1. The underlying model is the best-fitting reflection model absorbed by a partial coverer with varying covering fraction. The corresponding parameters are listed in Table 3. The data are strongly re-binned to facilitate visual inspection. Data of MOS2 are used in the spectral fits, but omitted in this plot to provide a clearer view. Lower panels: residuals belonging to each flux state. The spectra of eROSITA are scaled according to the fitted detector constant to match the EPIC-pn data. The wind is directly detected from the more prominent edge at 0.8 keV in the low-flux state.
Current usage metrics show cumulative count of Article Views (full-text article views including HTML views, PDF and ePub downloads, according to the available data) and Abstracts Views on Vision4Press platform.
Data correspond to usage on the plateform after 2015. The current usage metrics is available 48-96 hours after online publication and is updated daily on week days.
Initial download of the metrics may take a while.