Open Access
Fig. 7
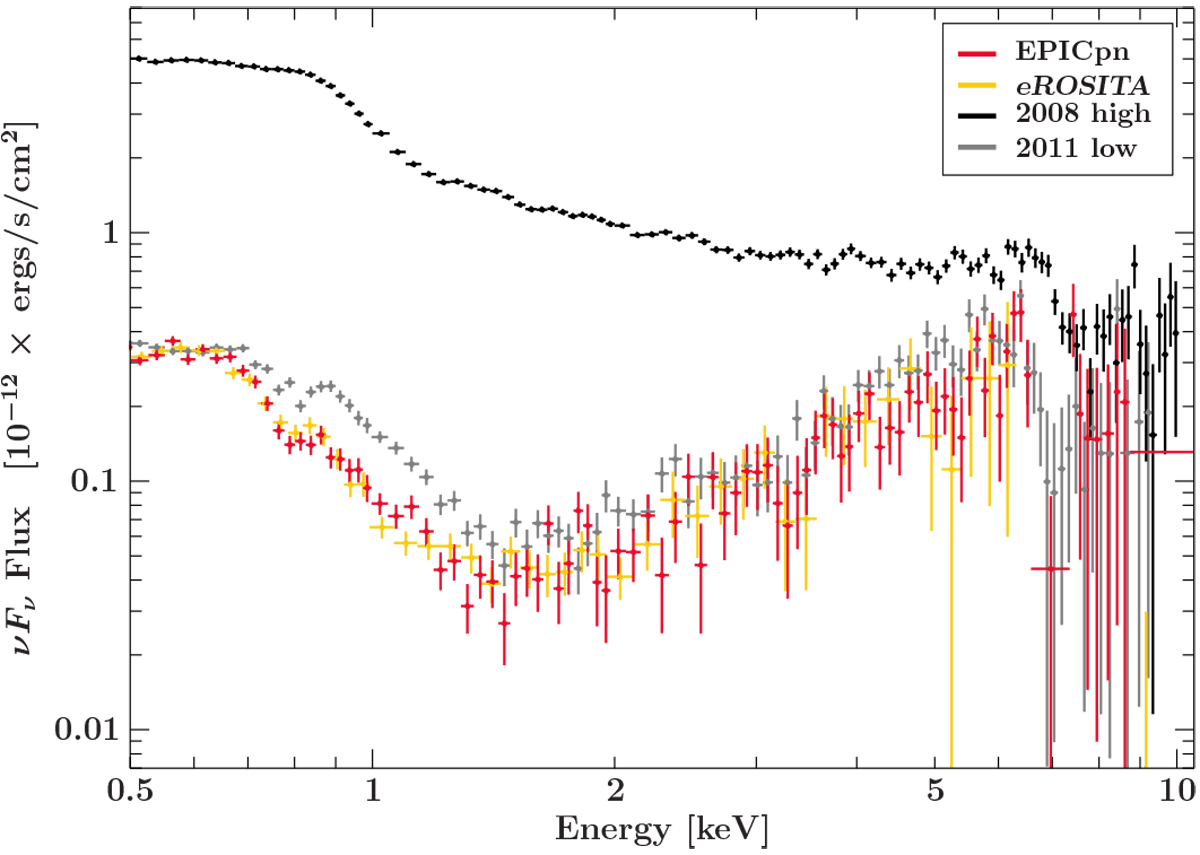
Comparison of the eROSITA and XMM-Newton observations using selected previous data; including the highest flux state observed in 2008 (327 ks Fabian et al. 2009) and the low flux state in 2011 (80 ks Fabian et al. 2012).
Current usage metrics show cumulative count of Article Views (full-text article views including HTML views, PDF and ePub downloads, according to the available data) and Abstracts Views on Vision4Press platform.
Data correspond to usage on the plateform after 2015. The current usage metrics is available 48-96 hours after online publication and is updated daily on week days.
Initial download of the metrics may take a while.