Fig. 5
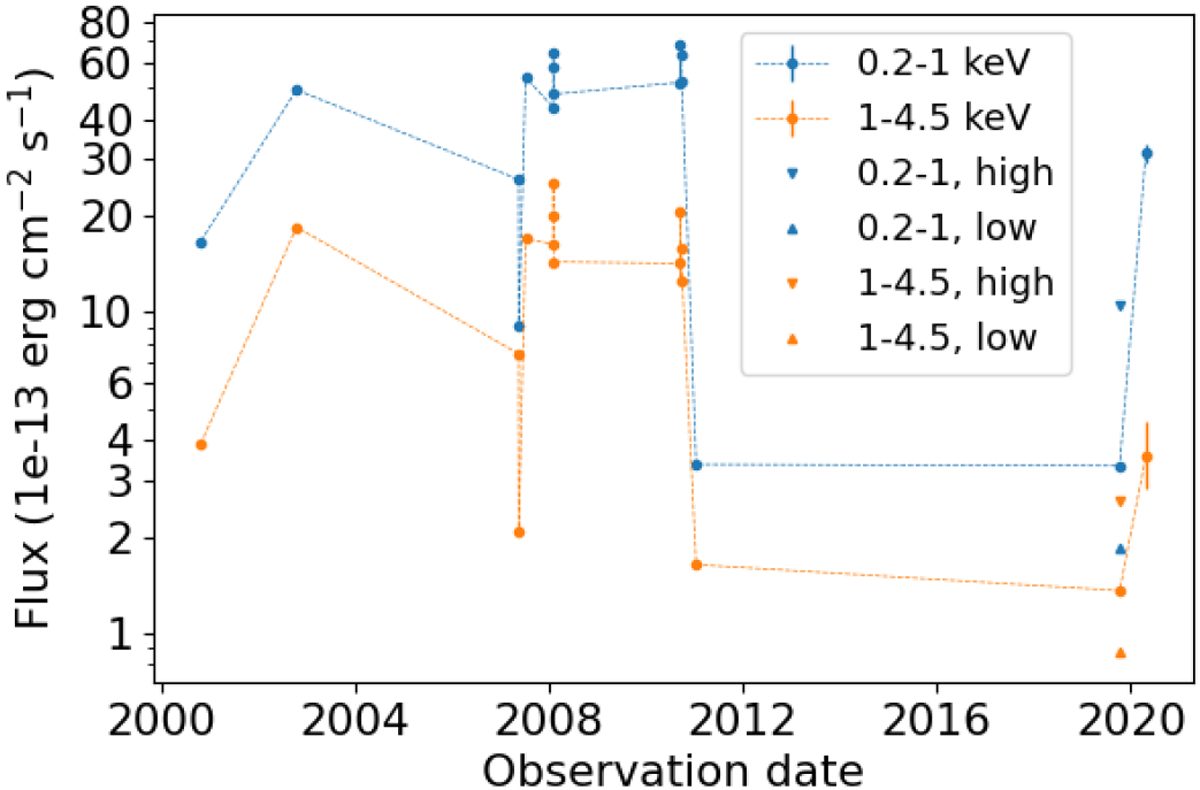
Soft and hard flux distribution of all XMM-Newton observations taken since the first observations in 2000 (Boller et al. 2002)and as of 2019 and 2020 (this paper). The energy bands used are (0.2–1.0) and (1.0–4.5) keV, respectively. The flux state of the hard band detected in 2019 simultaneous with the eROSITA observations is at a historical low. For the 2019 observations we also show the soft and hard high- and low-count-rate states. The data points for 2020 show the soft and hard fluxes obtained during the eROSITA all-sky survey observations. For illustration purposes we have connected the individual observations with the thin lines.
Current usage metrics show cumulative count of Article Views (full-text article views including HTML views, PDF and ePub downloads, according to the available data) and Abstracts Views on Vision4Press platform.
Data correspond to usage on the plateform after 2015. The current usage metrics is available 48-96 hours after online publication and is updated daily on week days.
Initial download of the metrics may take a while.