Fig. 4
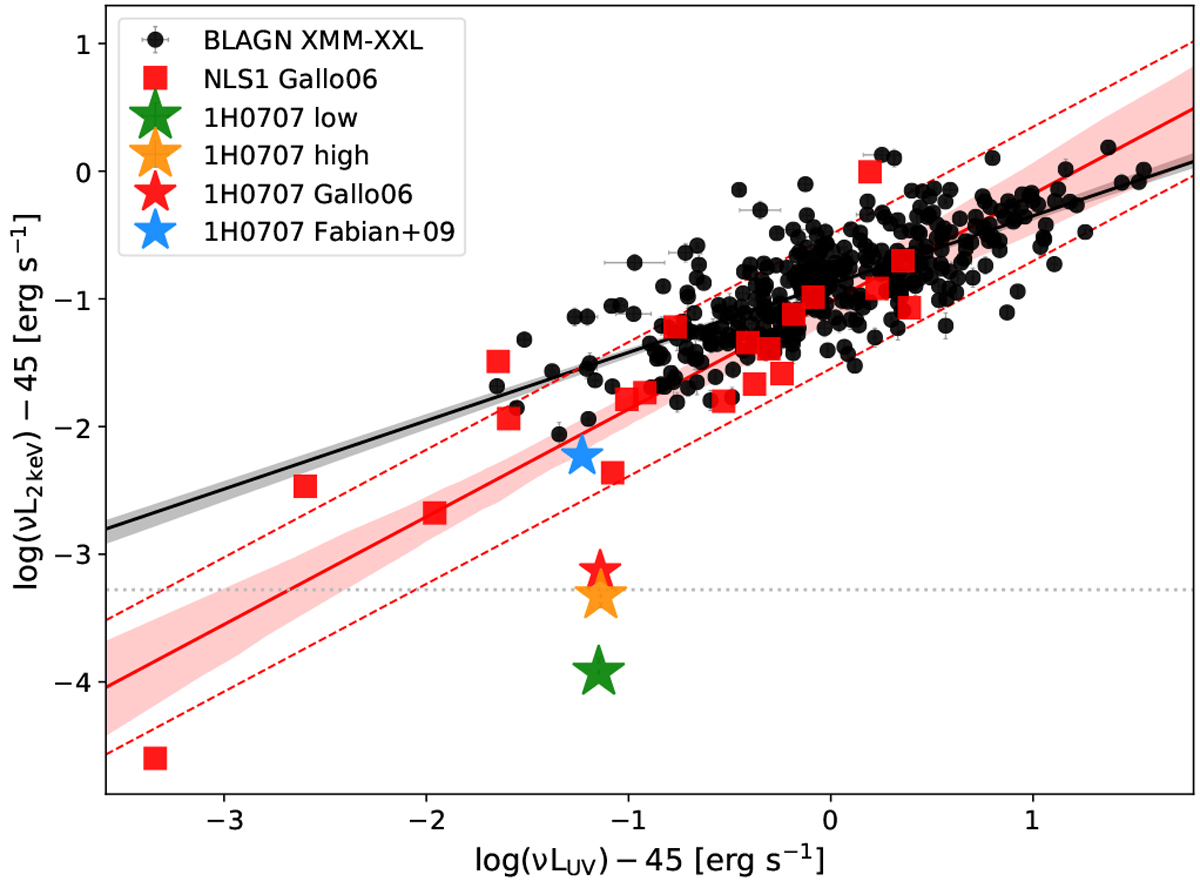
LX−LUV plane with our 1H 0707−495 observations in the high-(orange star) and low-(green star)-count-rate state. Results from an emcee (Foreman-Mackey et al. 2013) linear regression are shown for both broad-line AGNs (data points and regression as reported in Arcodia et al. 2019), (black circles; Liu et al. 2016) and NLS1s (data points from Gallo 2006, linear regression performed in this work). We computed the X-ray luminosity at 2 keV to compare with these literature measurements, while the UV proxy was computed at 3000, 2500, and 2910Å in XMM-XXL (Liu et al. 2016), NLS1 (Gallo 2006), and our OM-UVW1 data, respectively. The best-fit linear regressions emcee (Foreman-Mackey et al. 2013) are shown with a solid line, with corresponding 16th–84th percentile uncertainty intervals in a shaded area. The red dashed lines correspond to the fit intrinsic scatter of the NLS1 relation. The 2000 observation of 1H 0707−495 from Gallo (2006) is shown with a red star instead of a red square; the median flux level from the 2008 observations reported in Fabian et al. (2009) is shown with a light blue star. The 2 keV flux level during the eROSITA observation in the first all sky survey in April 2020 is shown with a grey dotted line.
Current usage metrics show cumulative count of Article Views (full-text article views including HTML views, PDF and ePub downloads, according to the available data) and Abstracts Views on Vision4Press platform.
Data correspond to usage on the plateform after 2015. The current usage metrics is available 48-96 hours after online publication and is updated daily on week days.
Initial download of the metrics may take a while.