Fig. 1
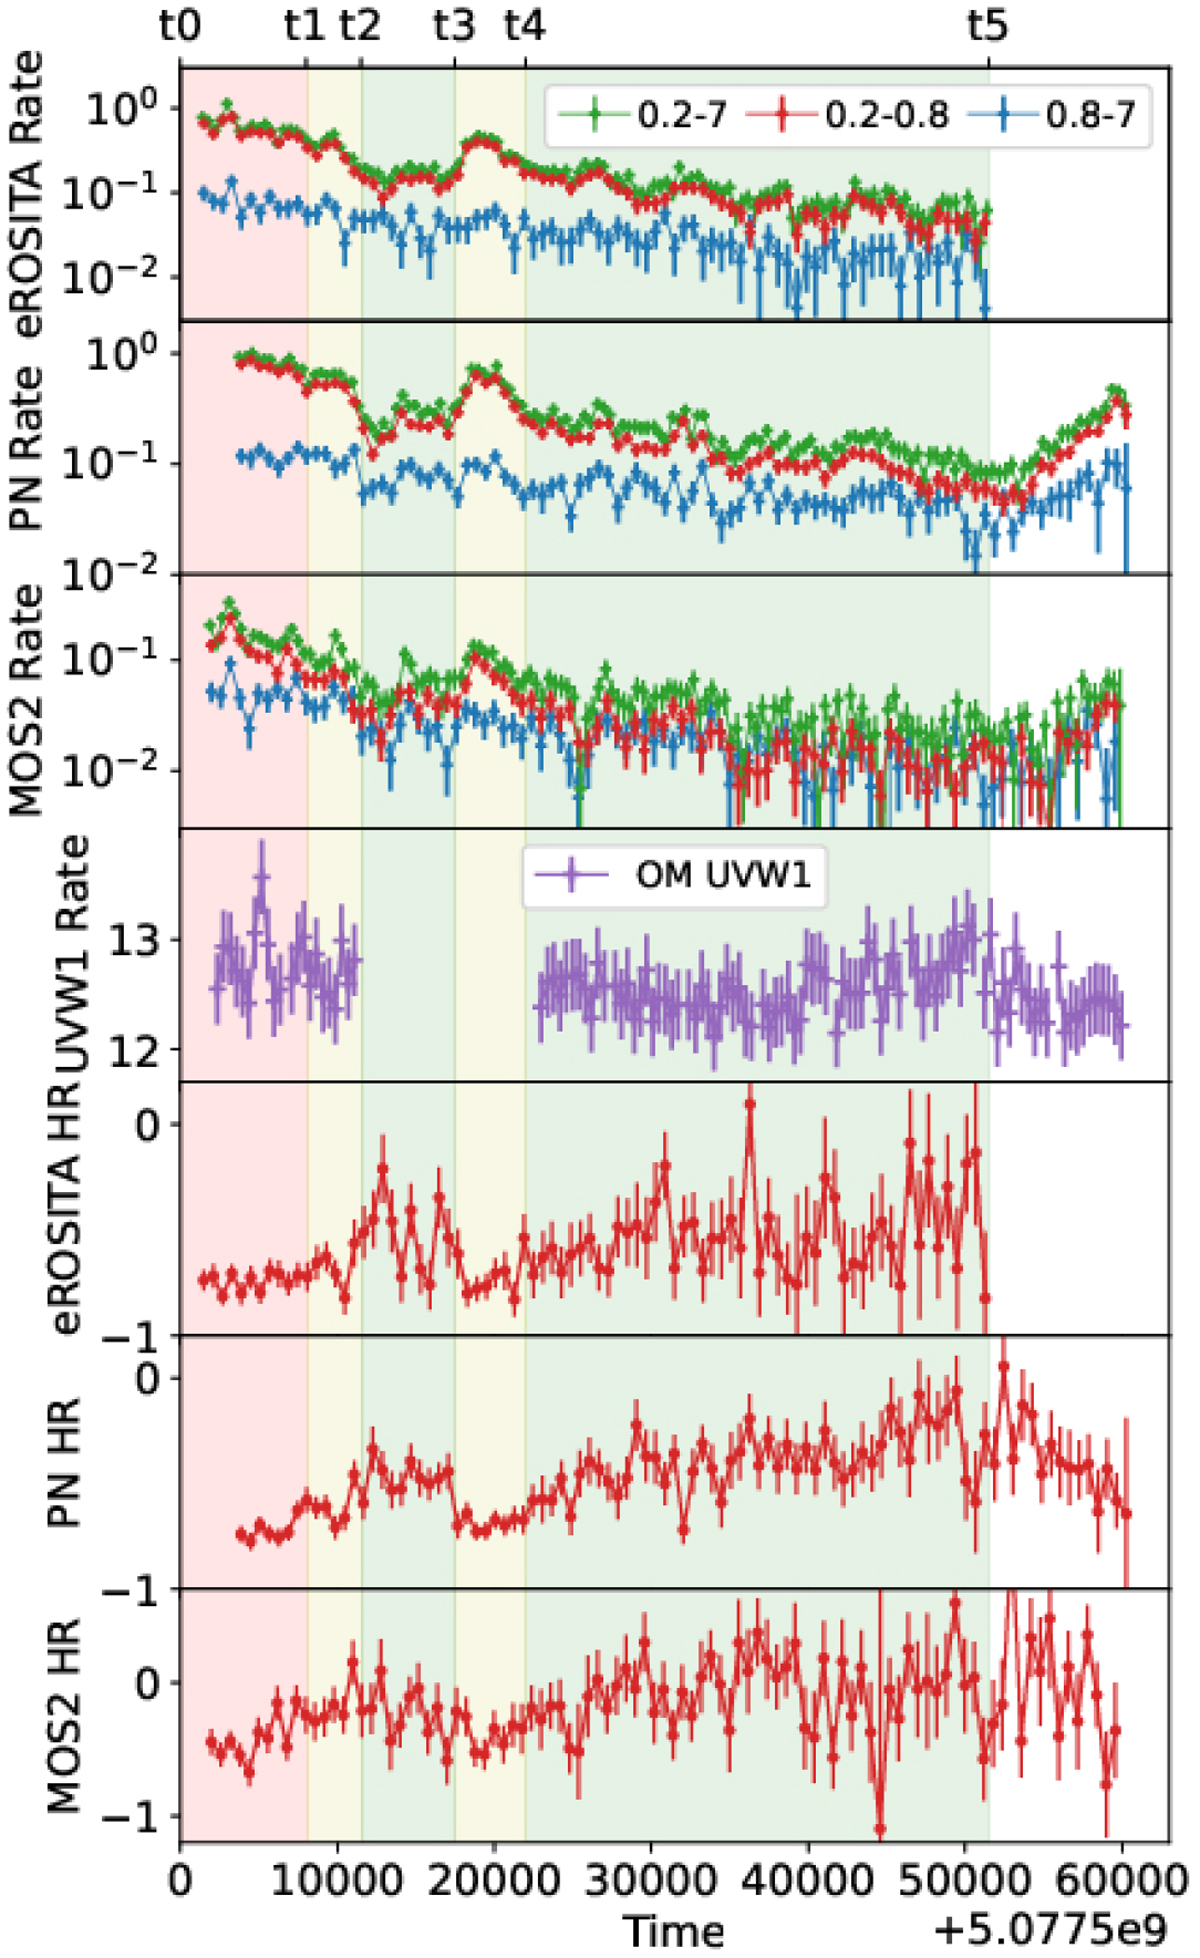
Top three panels: background-subtracted light curves in the total (0.2–7.0 keV), soft (0.2–0.8 keV), and hard (0.8–7.0 keV) bands for eROSITA, EPIC-PN, and EPIC-MOS, respectively. Large amplitude flux changes of about a factor > 50 are detected in the total and soft X-ray light curves, with a normalised excess value of 34.8 and 44.6 σ, respectively. The hard X-ray light curves and XMM OM light curve are much less variable, with normalised excess values of 2.1 and 1.7 σ, respectively (c.f. Sects. 3.2 and 3.3). The XMM OM light curve is shown in the fourth panel. The corresponding hardness ratios for the X-ray light curves are shown at the bottom. During the brightening the hardness ratio becomes softer and during low count rate intervals the hardness ratio is harder. Three count rate states referred to as high, medium, and low are marked with light red, yellow, and green colours (Sect. 2.1). The X-ray total-band light curves have a bin size of 400 s; the soft and hard bands have a bin size of 600 s.
Current usage metrics show cumulative count of Article Views (full-text article views including HTML views, PDF and ePub downloads, according to the available data) and Abstracts Views on Vision4Press platform.
Data correspond to usage on the plateform after 2015. The current usage metrics is available 48-96 hours after online publication and is updated daily on week days.
Initial download of the metrics may take a while.