Fig. 9.
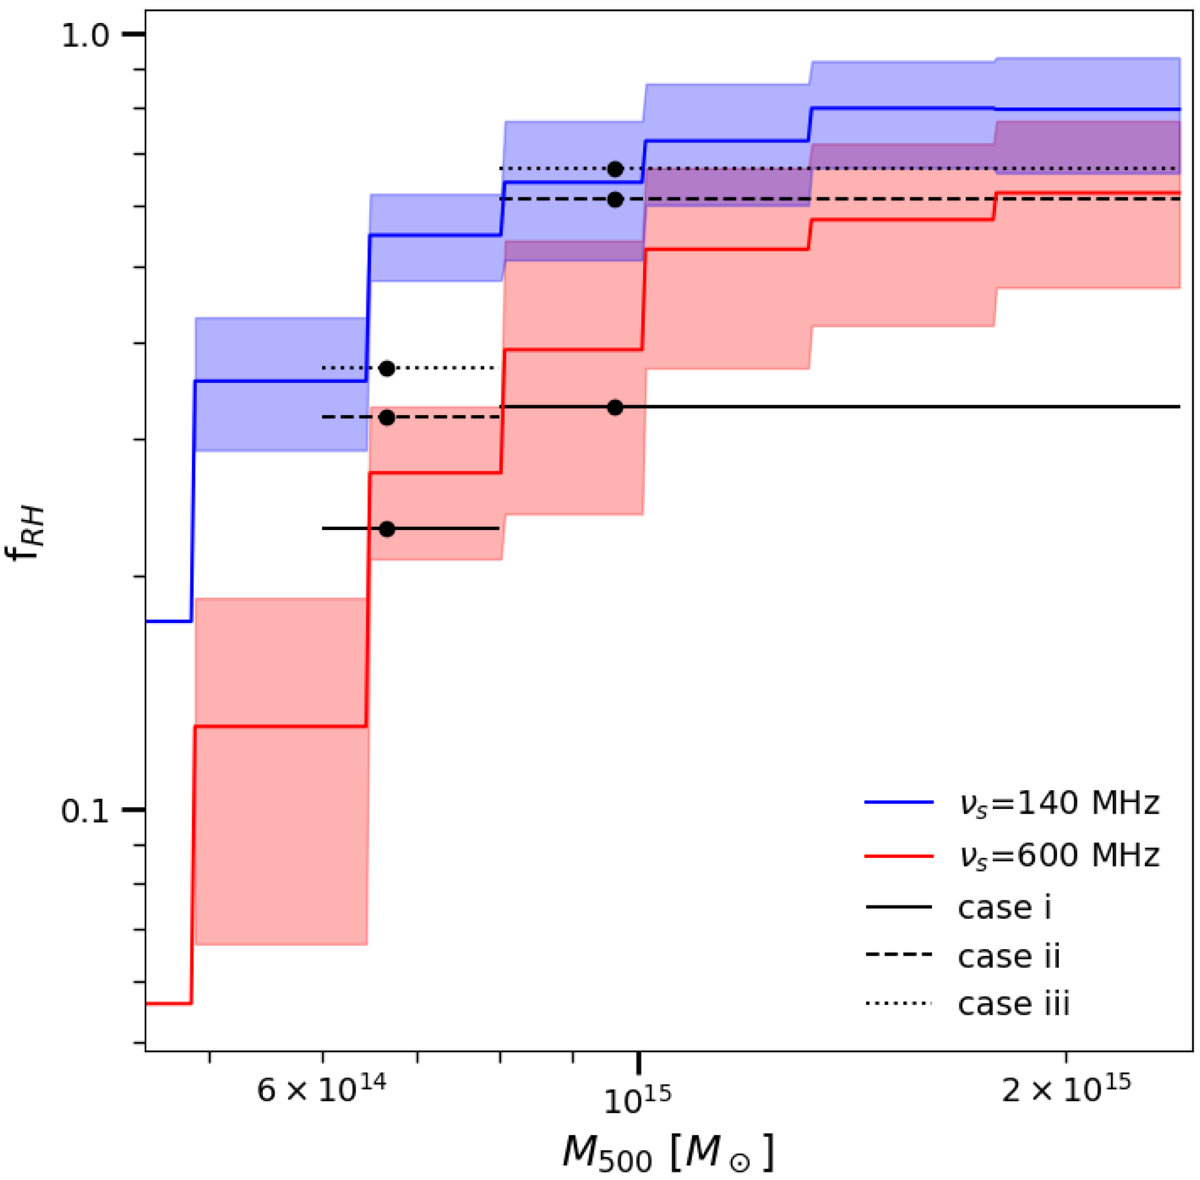
Expected fraction of clusters with radio halos with steepening frequency νs > 600 MHz and νs > 140 MHz in the redshift range 0.08 < z < 0.33 (red and blue lines, respectively). Shadowed regions represent the uncertainty on the model predictions taking into account the statistical error associated with the limited size of the observed sample. Calculations have been performed for the following choice of model parameters: b = 1.5, ⟨B⟩ = 1.9 μG (where B = ⟨B⟩×(M/⟨M⟩)b), and the fraction of energy channelled into particle acceleration ηt = 0.2 (see Cassano et al. 2012, and references therein). The observed fraction of clusters with radio halos in the two mass bins is overlaid (black lines) and refers to the three cases in Table 4 for the total sample. The dots represent the average mass of the clusters in the bins.
Current usage metrics show cumulative count of Article Views (full-text article views including HTML views, PDF and ePub downloads, according to the available data) and Abstracts Views on Vision4Press platform.
Data correspond to usage on the plateform after 2015. The current usage metrics is available 48-96 hours after online publication and is updated daily on week days.
Initial download of the metrics may take a while.