Fig. 8.
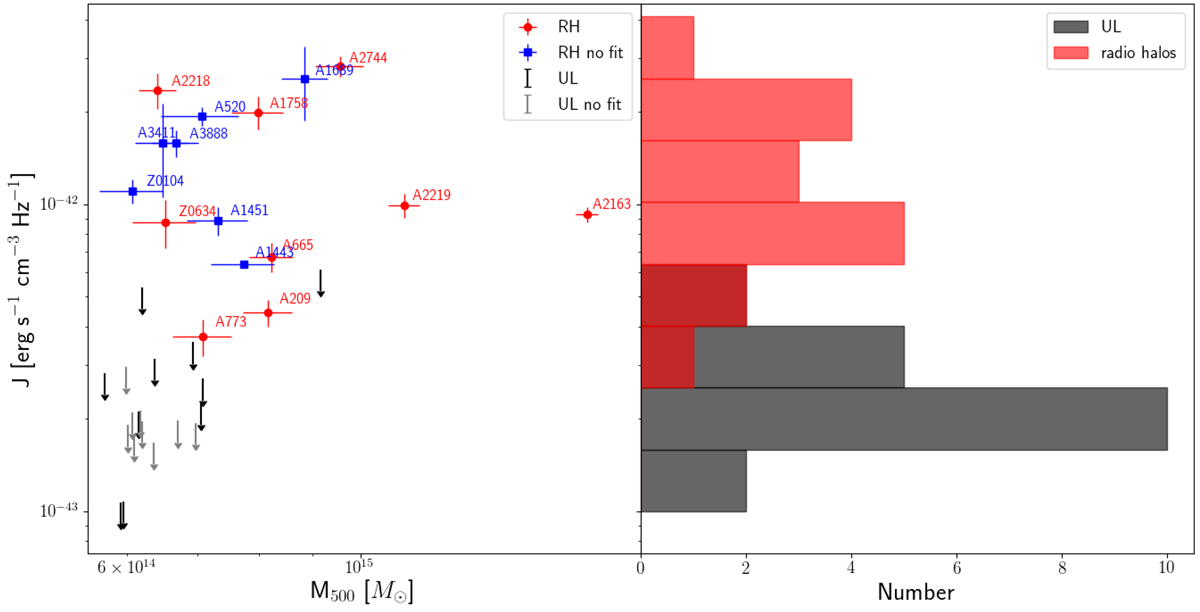
Emissivity vs mass diagram (left) and emissivity distribution (right). The red circles are radio halos with available radial profile, while the blue squares are the remaining radio halos. Upper limits derived in Paper I injecting an exponential model are represented with black arrows, while upper limits from the literature are the grey arrows.
Current usage metrics show cumulative count of Article Views (full-text article views including HTML views, PDF and ePub downloads, according to the available data) and Abstracts Views on Vision4Press platform.
Data correspond to usage on the plateform after 2015. The current usage metrics is available 48-96 hours after online publication and is updated daily on week days.
Initial download of the metrics may take a while.