Fig. 6.
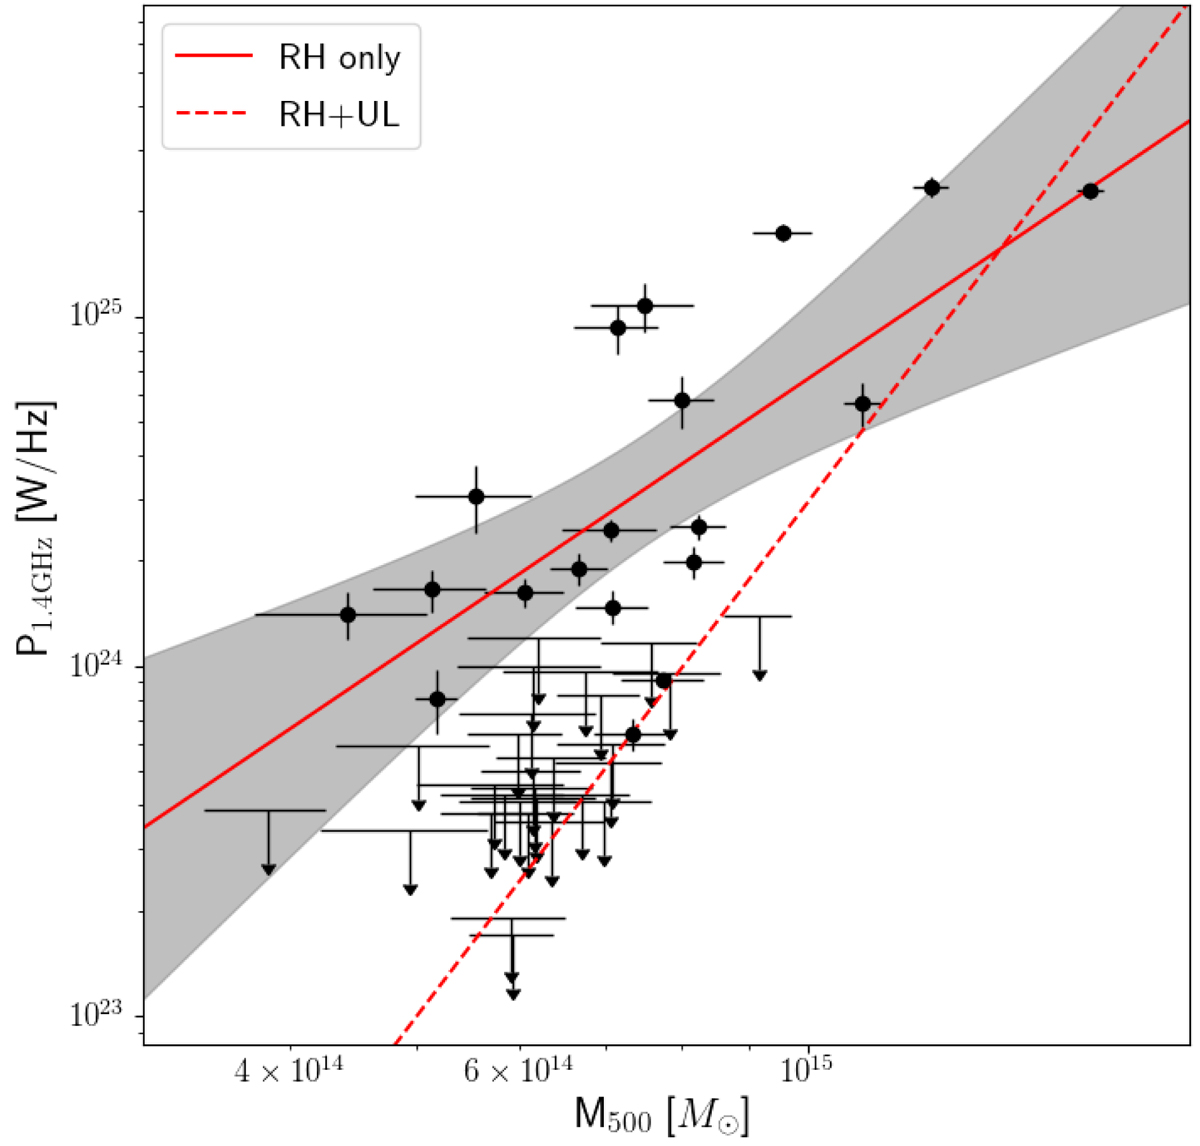
Distribution of radio halos and upper limits in the P1.4 GHz − M500 diagram after removing the five small radio halos. The best-fit relation including only radio halos derived with the EM regression method is shown with its 95% confidence region (red solid line and shadowed region). The dashed line is the EM best-fit relation to radio halos plus upper limits.
Current usage metrics show cumulative count of Article Views (full-text article views including HTML views, PDF and ePub downloads, according to the available data) and Abstracts Views on Vision4Press platform.
Data correspond to usage on the plateform after 2015. The current usage metrics is available 48-96 hours after online publication and is updated daily on week days.
Initial download of the metrics may take a while.