Fig. 4.
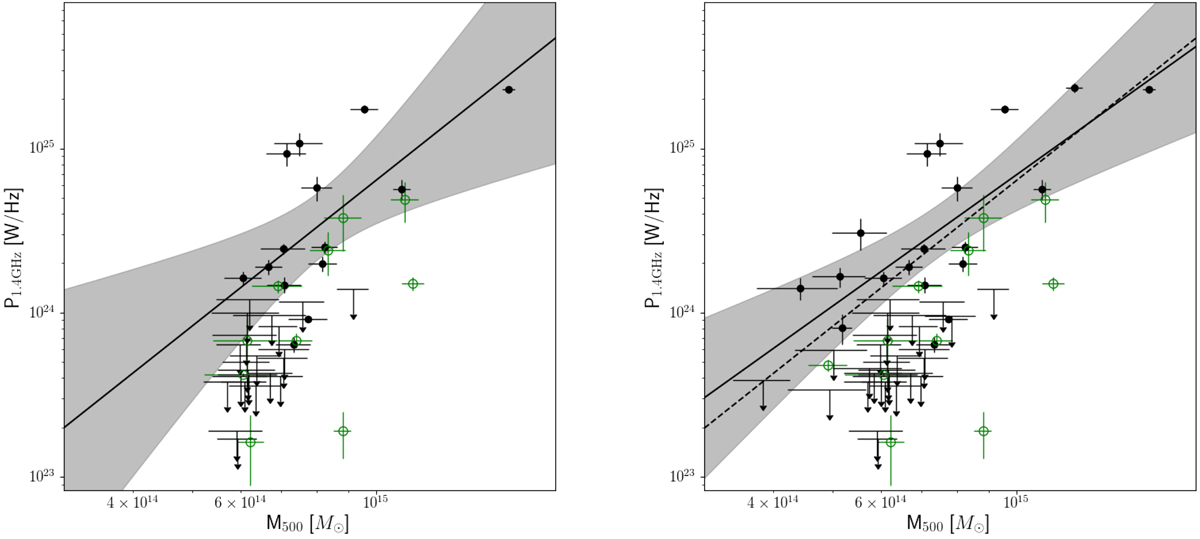
P1.4 GHz − M500 diagram for the clusters of the statistical sample (left) and extended sample (right). Black filled circles are radio halos, arrows are upper limits, and green empty circles are USSRHs or candidate USSRHs. The black line and grey shadowed region show the best-fit relations (using the BCES Y|X method) and the 95% confidence region to radio halos only. For a clear comparison, also shown is the best-fit relation (right panel, dashed line) obtained for the statistical sample (left panel).
Current usage metrics show cumulative count of Article Views (full-text article views including HTML views, PDF and ePub downloads, according to the available data) and Abstracts Views on Vision4Press platform.
Data correspond to usage on the plateform after 2015. The current usage metrics is available 48-96 hours after online publication and is updated daily on week days.
Initial download of the metrics may take a while.