Fig. 3.
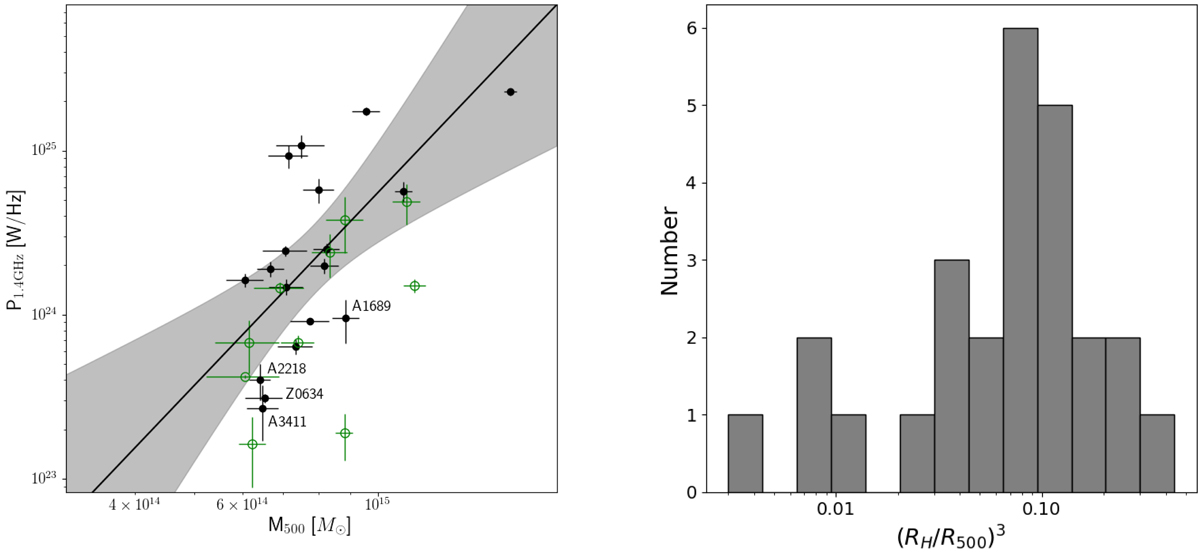
Radio power–mass diagram and volume distribution of the radio halos of the statistical sample. Left: P1.4 GHz − M500 diagram. Black filled circles represent radio halos; green empty circles represent USSRHs and candidate USSRHs. The small radio halos are labelled. The best-fit relation obtained with the BCES Y|X method and excluding USSRHs is shown with its 95% confidence region. The best-fit parameters are B = 3.92 ± 0.79 and A = −0.15 ± 0.10. Right: distribution of the volumes of the radio halos, scaled for R500. The four clusters lying on the left tail, separated from the main distribution, are A3411, Z0634, A2218, and A1689.
Current usage metrics show cumulative count of Article Views (full-text article views including HTML views, PDF and ePub downloads, according to the available data) and Abstracts Views on Vision4Press platform.
Data correspond to usage on the plateform after 2015. The current usage metrics is available 48-96 hours after online publication and is updated daily on week days.
Initial download of the metrics may take a while.