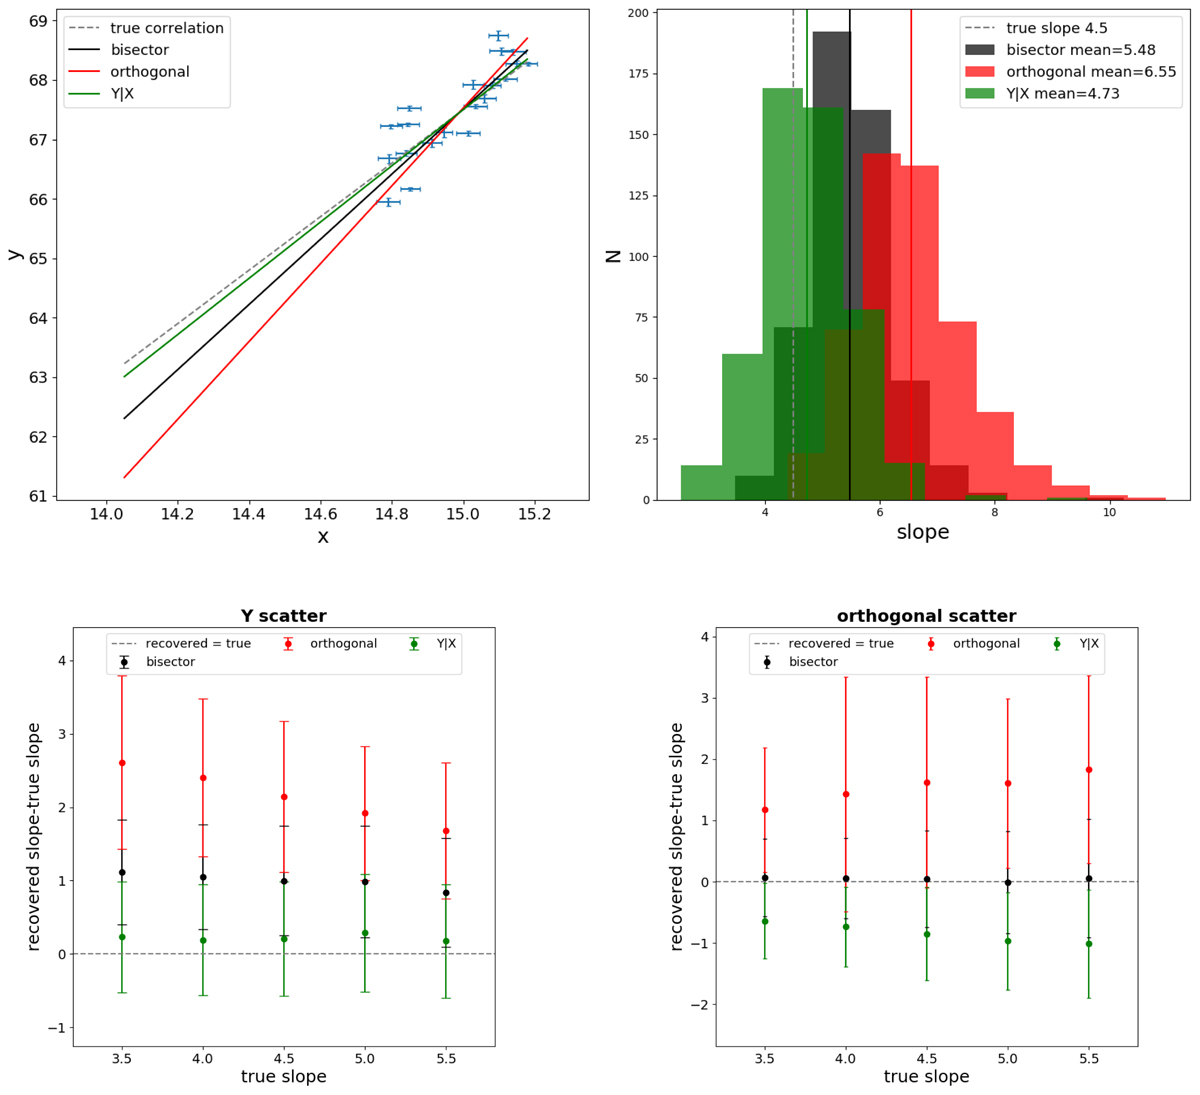
Fig. A.1.

Top panel: left: one example of the 500 Monte Carlo runs with true correlation slope 4.5 and X cut at 14.77 (corresponding to a mass cut of 6 × 10¹⁴). Right: distribution of the recovered slopes with the bisector (black), orthogonal (red), and Y|X (green) methods. The vertical lines represent the mean value of the recovered slopes and the dashed line is the true slope. These mean values of the slopes are used to draw the correlation lines in left panel. Bottom panels: difference between recovered and true slope as a function of the true slope for the three fitting methods. The dots represent the mean values of the distributions, while the error bars are as large as the standard deviation of the distribution of the recovered slopes. The horizontal grey line represents the case where the recovered slope matches the true slope. In the left panel we used the Y scatter, in the right panel the orthogonal scatter.
Current usage metrics show cumulative count of Article Views (full-text article views including HTML views, PDF and ePub downloads, according to the available data) and Abstracts Views on Vision4Press platform.
Data correspond to usage on the plateform after 2015. The current usage metrics is available 48-96 hours after online publication and is updated daily on week days.
Initial download of the metrics may take a while.


