Fig. 1.
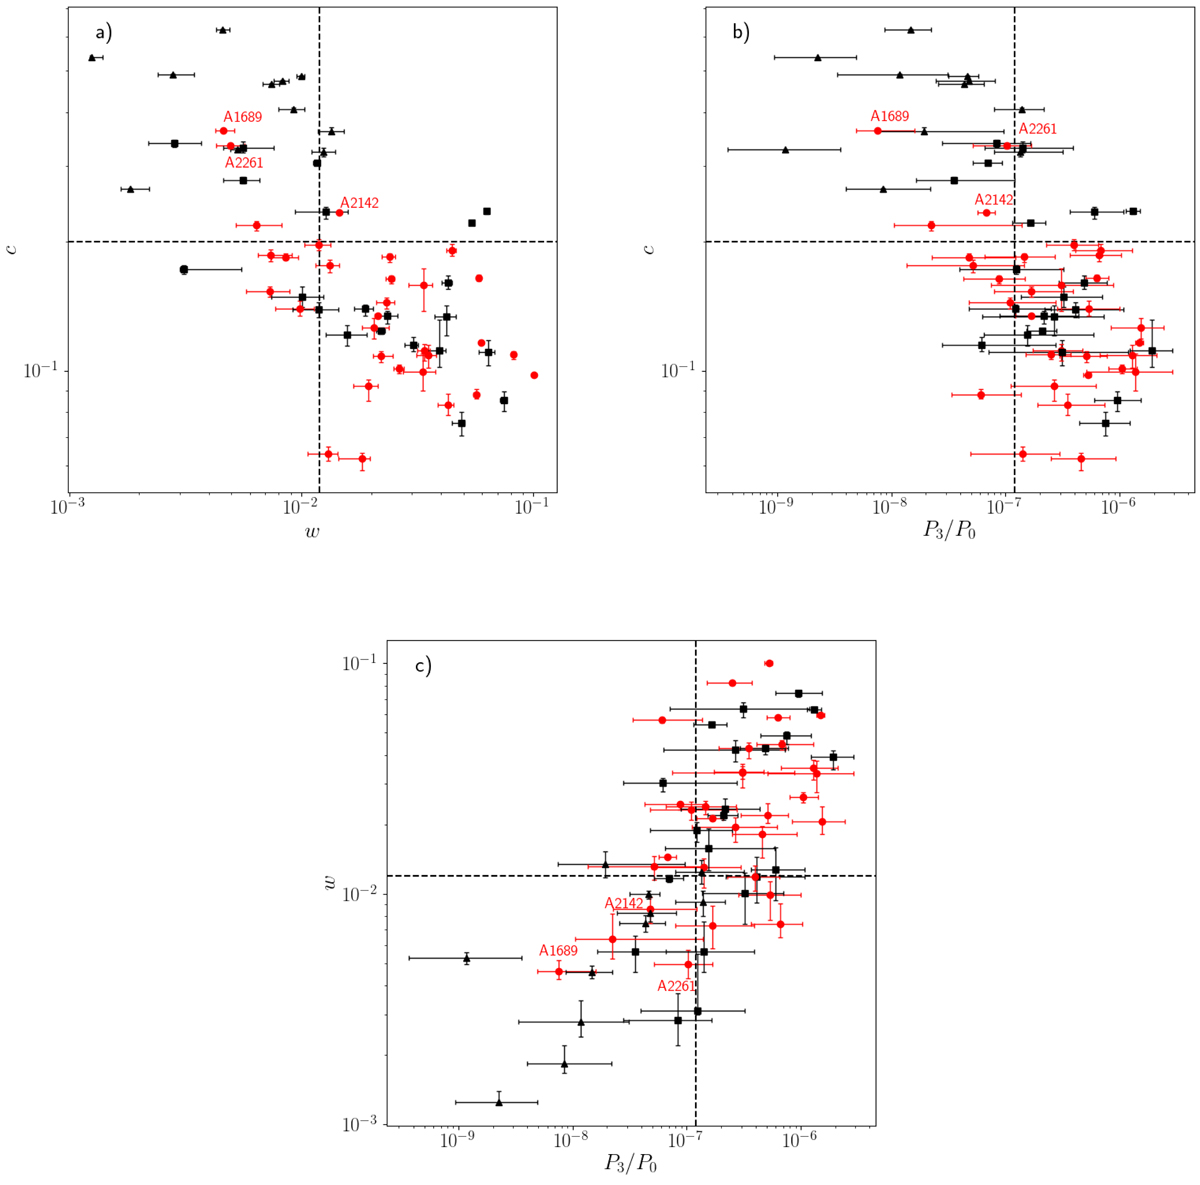
Morphological diagrams for the clusters in our sample with available X-ray Chandra data: (a) c − w, (b) c − P3/P0, and (c) w − P3/P0. Vertical and horizontal dashed lines are adapted from Cassano et al. (2010a): c = 0.2, w = 0.012, and P3/P0 = 1.2 × 10⁻⁷. The red circles represent radio halos, black squares clusters without radio halos, and black triangles clusters with mini halos. The values of the parameters plotted here are listed in Paper I, Table 5. Clusters that are explicitly mentioned in the text are labelled in red.
Current usage metrics show cumulative count of Article Views (full-text article views including HTML views, PDF and ePub downloads, according to the available data) and Abstracts Views on Vision4Press platform.
Data correspond to usage on the plateform after 2015. The current usage metrics is available 48-96 hours after online publication and is updated daily on week days.
Initial download of the metrics may take a while.