Fig. 7.
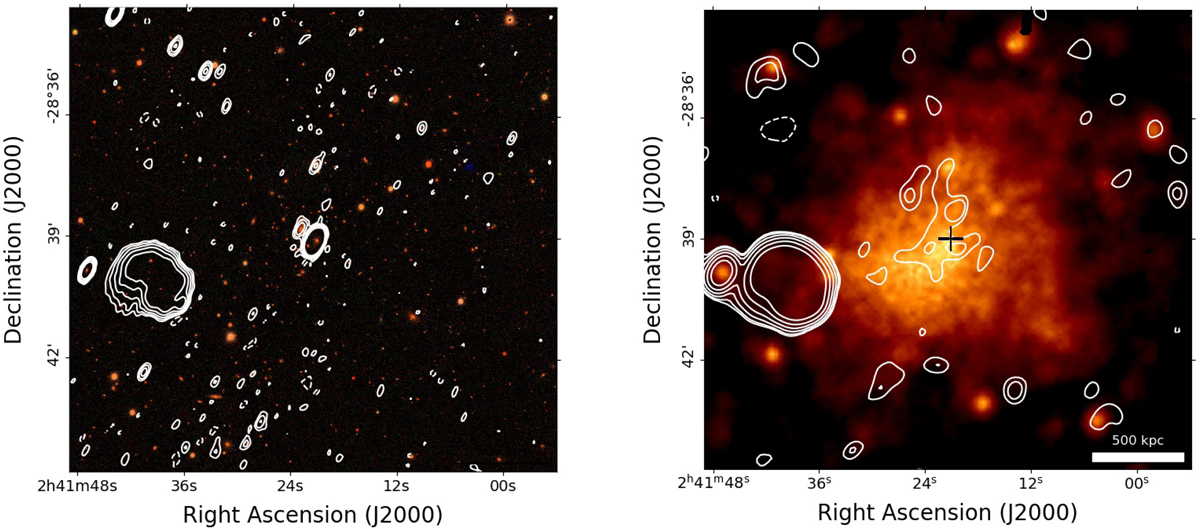
Images of the cluster A3041. Left: high-resolution JVLA C array contours (red) superimposed on the PanSTARRS optical image. Contours start at 0.1 mJy beam−1 and are spaced by a factor of two. The first negative contour is dashed. Right: X-ray XMM-Newton image with low-resolution (35.8″ × 25.5″) JVLA C array contours overlaid. Contours are (±2, 3, 6...) × σrms with σrms = 0.08 mJy beam−1. The discrete sources in the field are subtracted, except for the region of the FRII radio galaxy. The black cross marks the position of the central brightest radio source.
Current usage metrics show cumulative count of Article Views (full-text article views including HTML views, PDF and ePub downloads, according to the available data) and Abstracts Views on Vision4Press platform.
Data correspond to usage on the plateform after 2015. The current usage metrics is available 48-96 hours after online publication and is updated daily on week days.
Initial download of the metrics may take a while.