Fig. 6.
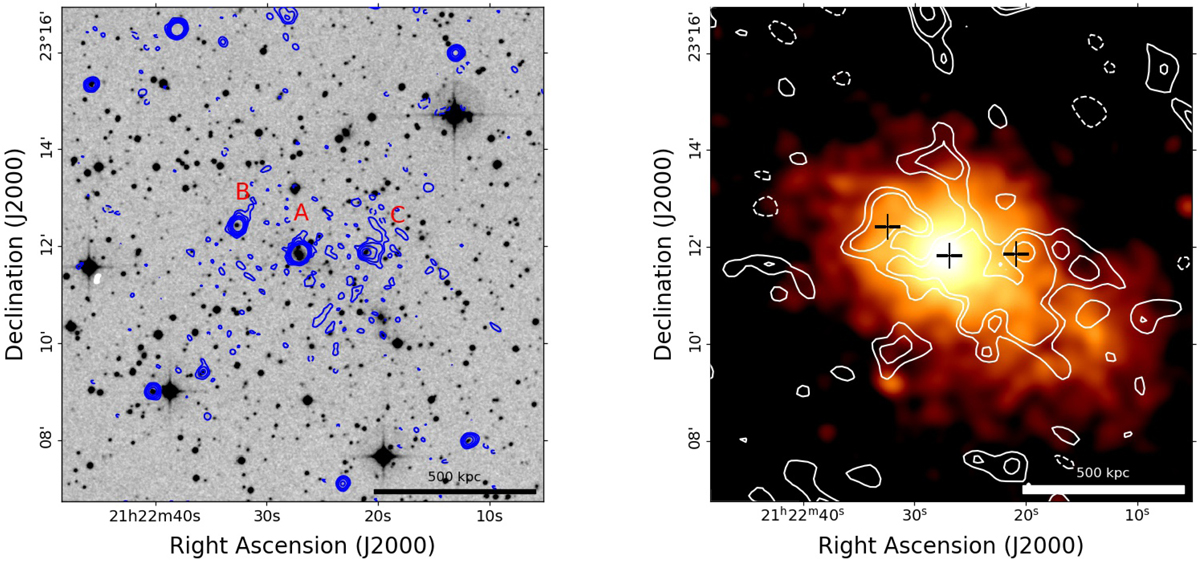
GMRT images of the cluster Z2120. Left: DSS optical image with GMRT high-resolution contours overlaid. Contours start at 0.1 mJy beam−1 and are spaced by a factor of two. The first negative contour is dashed. Labels mark the position of discrete sources. Right: GMRT 330 MHz low-resolution (32.7″ × 28″) contours after the subtraction of compact sources superimposed on the Chandra X-ray image. Contours are (2,3,6...) × σ, with σ = 0.3 mJy beam−1. The position of the discrete sources is marked with a black cross.
Current usage metrics show cumulative count of Article Views (full-text article views including HTML views, PDF and ePub downloads, according to the available data) and Abstracts Views on Vision4Press platform.
Data correspond to usage on the plateform after 2015. The current usage metrics is available 48-96 hours after online publication and is updated daily on week days.
Initial download of the metrics may take a while.