Fig. 5.
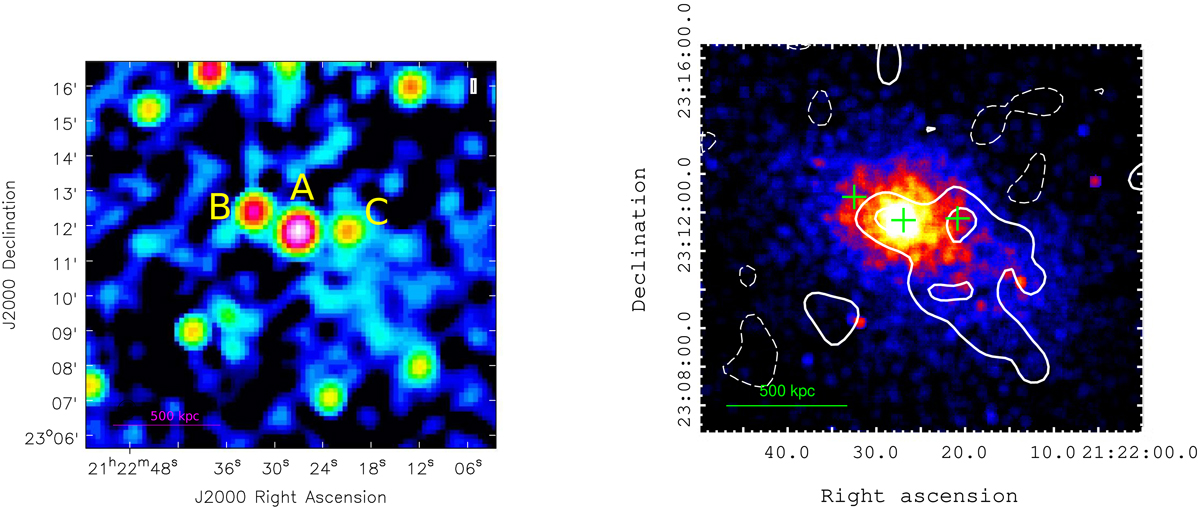
JVLA image of the cluster Z2120. Left: JVLA D array image. The resolution is 33″ × 30″ and the rms noise is 0.06 mJy beam−1. Labels mark the discrete sources in the cluster field. Right: low-resolution (55″ × 54″) JVLA contours after the compact sources subtraction overlaid over the X-ray Chandra image. Contours are drawn at (3,6...) × σ, with σ = 0.1 mJy beam−1. The 2-σ negative contour is dashed. The green crosses mark the position of the three sources at the cluster centre, which have been subtracted.
Current usage metrics show cumulative count of Article Views (full-text article views including HTML views, PDF and ePub downloads, according to the available data) and Abstracts Views on Vision4Press platform.
Data correspond to usage on the plateform after 2015. The current usage metrics is available 48-96 hours after online publication and is updated daily on week days.
Initial download of the metrics may take a while.