Fig. B.1.
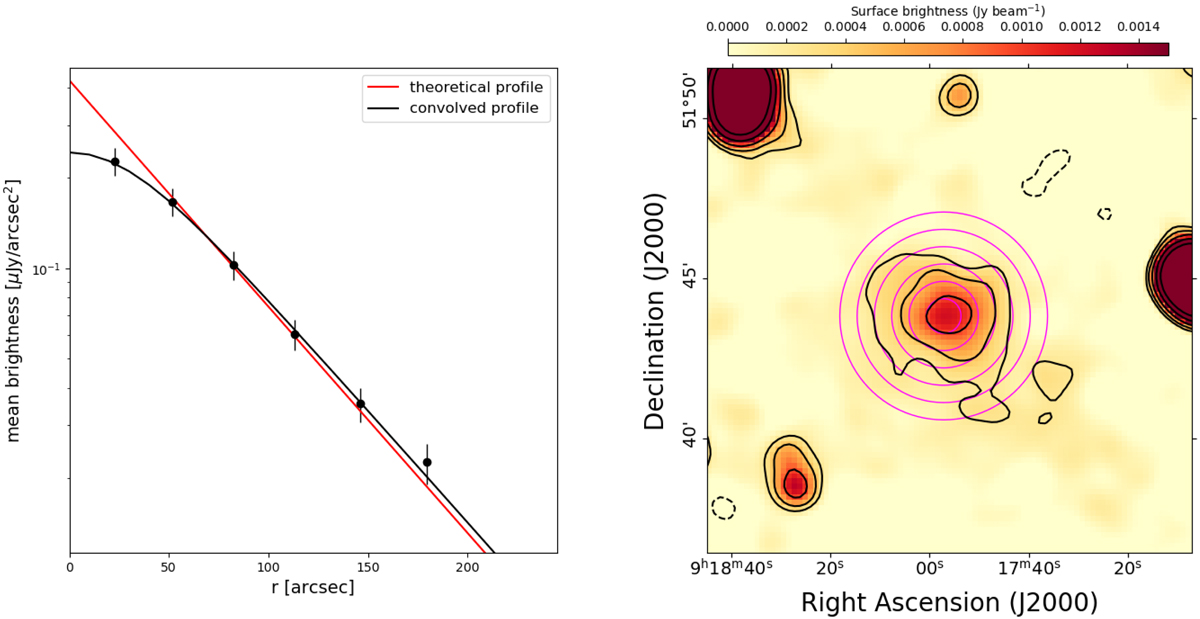
Radial surface brightness profile of the radio halo in A773. Left: data points represents the averaged surface brightness measured in the magenta annuli shown in the right panel. The red curve is the theoretical exponential profile and the black curve is the profile convolved with the beam of the image. Right: radio image of A773 (see Table B.1). Contours start at 3-σ rms noise and are spaced by a factor of two. The orange circle in the bottom left corner shows the size of the beam.
Current usage metrics show cumulative count of Article Views (full-text article views including HTML views, PDF and ePub downloads, according to the available data) and Abstracts Views on Vision4Press platform.
Data correspond to usage on the plateform after 2015. The current usage metrics is available 48-96 hours after online publication and is updated daily on week days.
Initial download of the metrics may take a while.