Fig. 2.
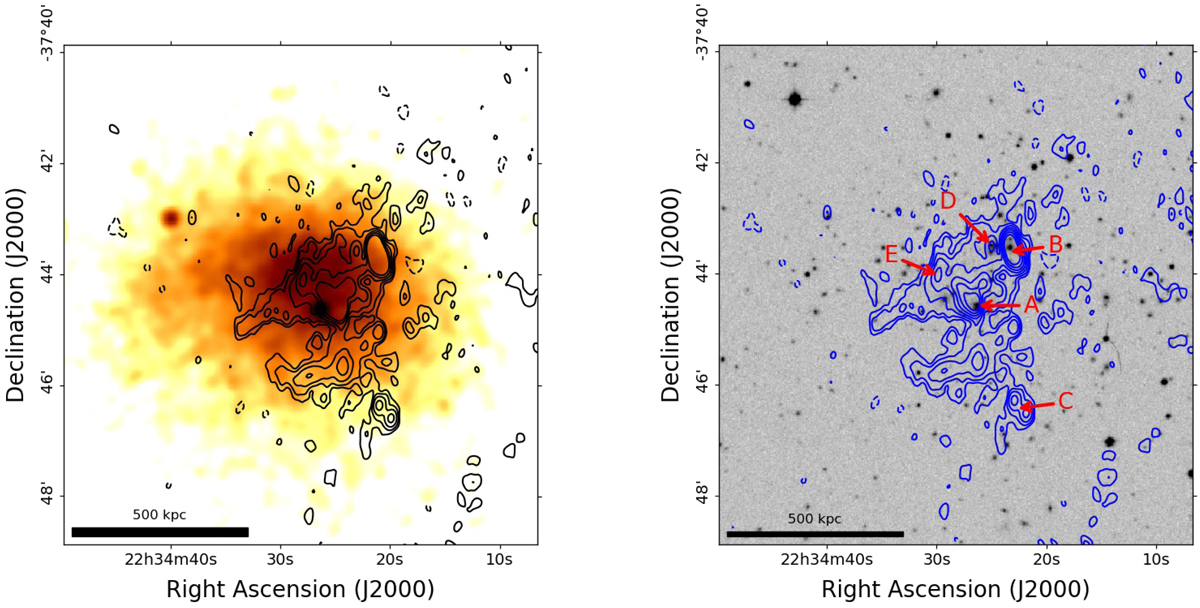
Images of the cluster A3888. Left: X-ray Chandra image (colours) with GMRT 33 MHz contours superimposed. Contours start from 0.9 mJy beam−1 and are spaced by a factor of two. The −0.9 mJy beam−1 contour is dashed. Right: same contours as in the left panel superimposed on the optical DSS image. Labels mark the position of discrete radio sources (A to D) and E indicates a patch of diffuse emission with no optical counterpart that we consider to be part of the halo.
Current usage metrics show cumulative count of Article Views (full-text article views including HTML views, PDF and ePub downloads, according to the available data) and Abstracts Views on Vision4Press platform.
Data correspond to usage on the plateform after 2015. The current usage metrics is available 48-96 hours after online publication and is updated daily on week days.
Initial download of the metrics may take a while.