Fig. 10.
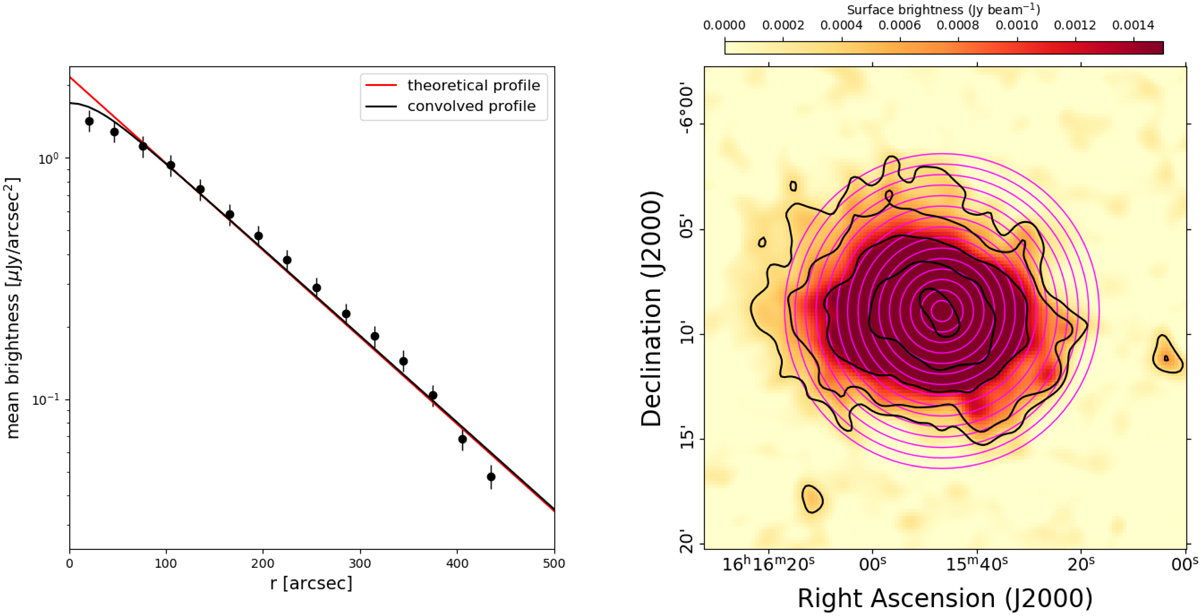
Radial surface brightness profile of the radio halo in A2163. Left: data points represents the averaged surface brightness measured in the annuli shown in the right panel. The red curve is the theoretical exponential profile, the black curve is the profile convolved with the beam of the image. Right: VLA 1.4 GHz image from where the profile on the left panel has been extracted. The magenta annuli represent the regions where the average surface brightness was measured. Contours start at 3−σ and are spaced by a factor of two. The 1-σ rms noise of the image is 0.1 mJy beam−1 with beam = 60″ × 60″.
Current usage metrics show cumulative count of Article Views (full-text article views including HTML views, PDF and ePub downloads, according to the available data) and Abstracts Views on Vision4Press platform.
Data correspond to usage on the plateform after 2015. The current usage metrics is available 48-96 hours after online publication and is updated daily on week days.
Initial download of the metrics may take a while.