Fig. 1.
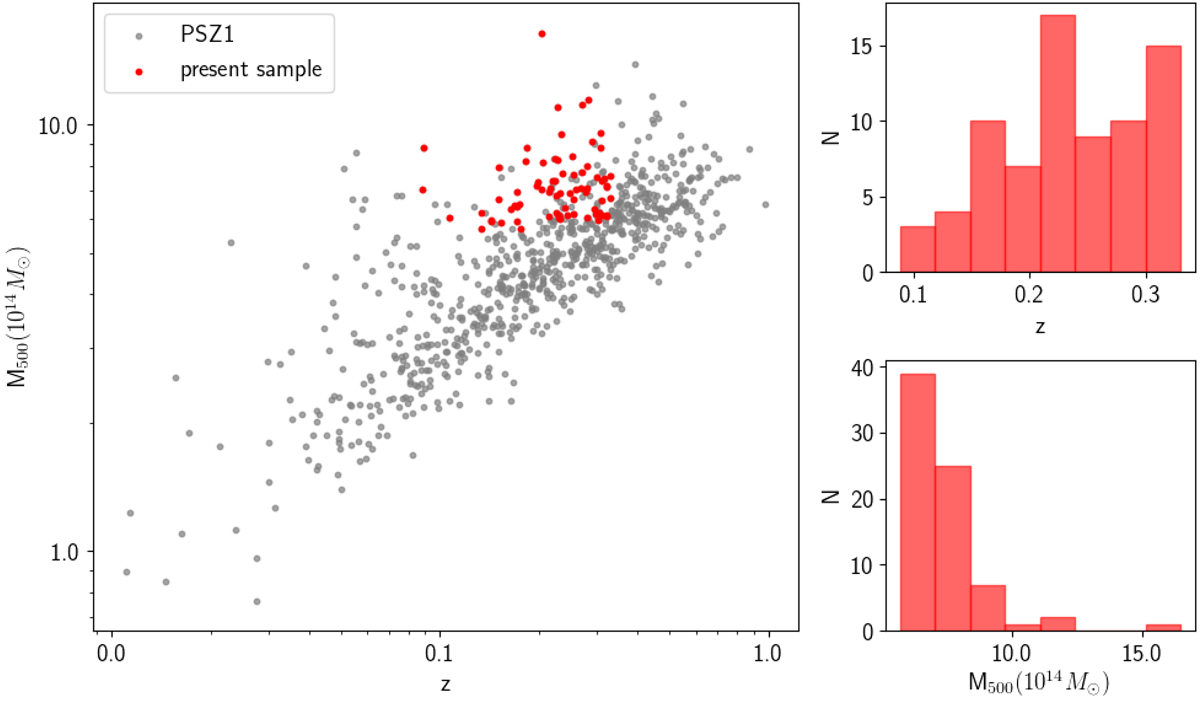
Mass and redshift distribution of the clusters of the sample. Left: distribution of the clusters of the Planck SZ cluster catalogue in the M500 − z diagram. Clusters belonging to the sample presented here are marked in red. Top right: redshift distribution of the clusters of our sample distribution. Bottom right: mass distribution of the clusters of our sample.
Current usage metrics show cumulative count of Article Views (full-text article views including HTML views, PDF and ePub downloads, according to the available data) and Abstracts Views on Vision4Press platform.
Data correspond to usage on the plateform after 2015. The current usage metrics is available 48-96 hours after online publication and is updated daily on week days.
Initial download of the metrics may take a while.