Fig. 7
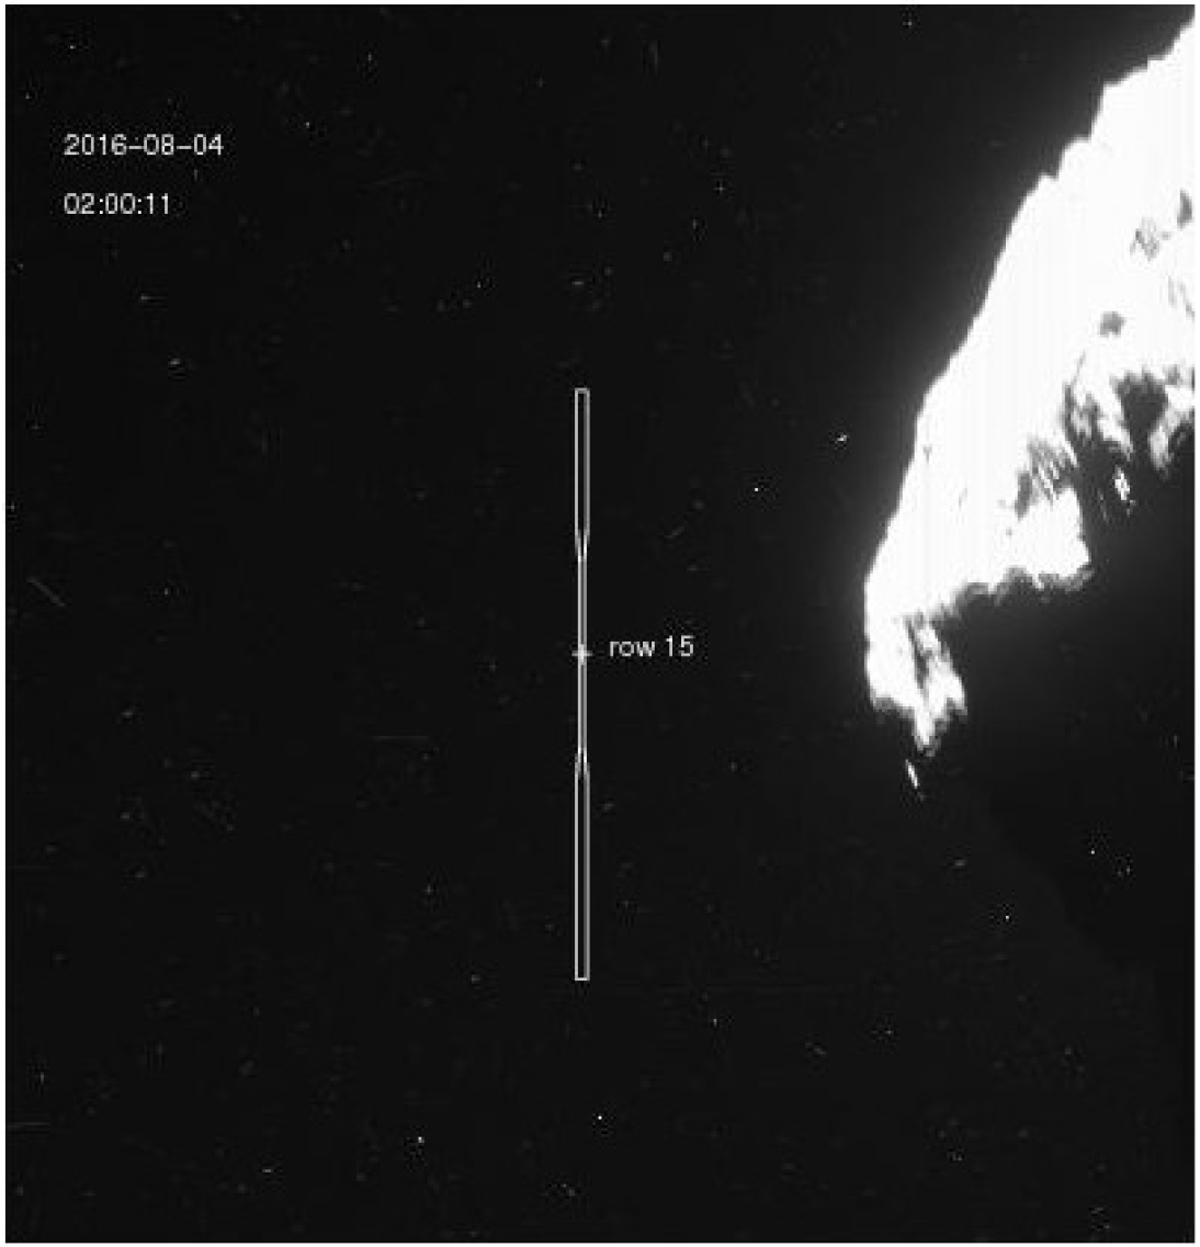
Comparison of the observed (crosses) and modelled (coloured lines) brightness of four emission features, OI1356 (a), CI1657 and CO4PG (b), Lyman-β and OI1027 (c) and OI1304 (d), during four time periods, during which a CIR was observed at comet 67P, on 4 Aug. 2016 (see Table 4). The observed brightnesses are from three regions of the FUV spectrograph slit (rows 8–11 [red], 13–16 [black] and 18–21 [blue]). Vertical black lines link simultaneous measurements of the brightness.
Current usage metrics show cumulative count of Article Views (full-text article views including HTML views, PDF and ePub downloads, according to the available data) and Abstracts Views on Vision4Press platform.
Data correspond to usage on the plateform after 2015. The current usage metrics is available 48-96 hours after online publication and is updated daily on week days.
Initial download of the metrics may take a while.