Fig. 6
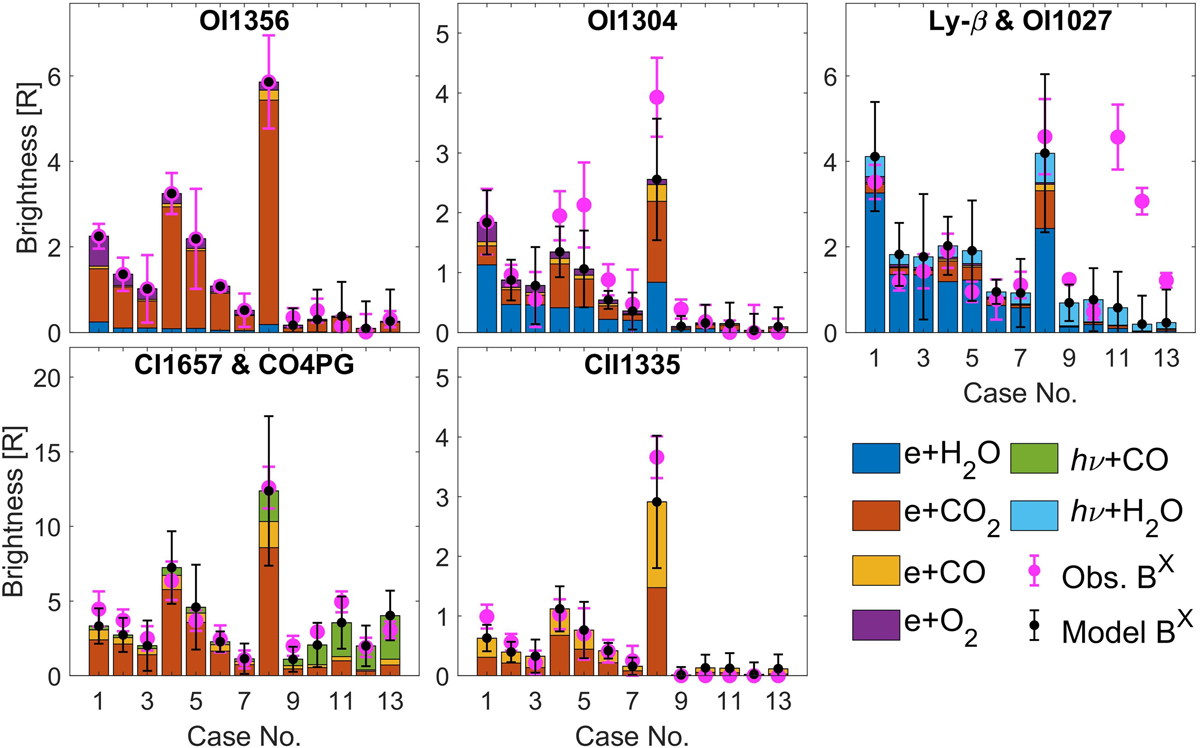
Comparison of the total modelled (black) and observed brightness (magenta), BX, of each emission line. The stacked bars show the contribution from each neutral species and emission process. The same colour code as Fig. 4 is used. The error on the observed brightness is derived from the integration of the FUV spectra. The error on the modelled brightness is from the temporal variation of the electron flux and column density, as well as a 20% uncertainty in the neutral composition. In cases 1–8, where the observed OI1356 brightness is used to fit the total neutral column density (see Sect. 3.2), the error on the modelled OI1356 brightness is included in the error of the other modelled emission brightnesses.
Current usage metrics show cumulative count of Article Views (full-text article views including HTML views, PDF and ePub downloads, according to the available data) and Abstracts Views on Vision4Press platform.
Data correspond to usage on the plateform after 2015. The current usage metrics is available 48-96 hours after online publication and is updated daily on week days.
Initial download of the metrics may take a while.