Fig. B.2
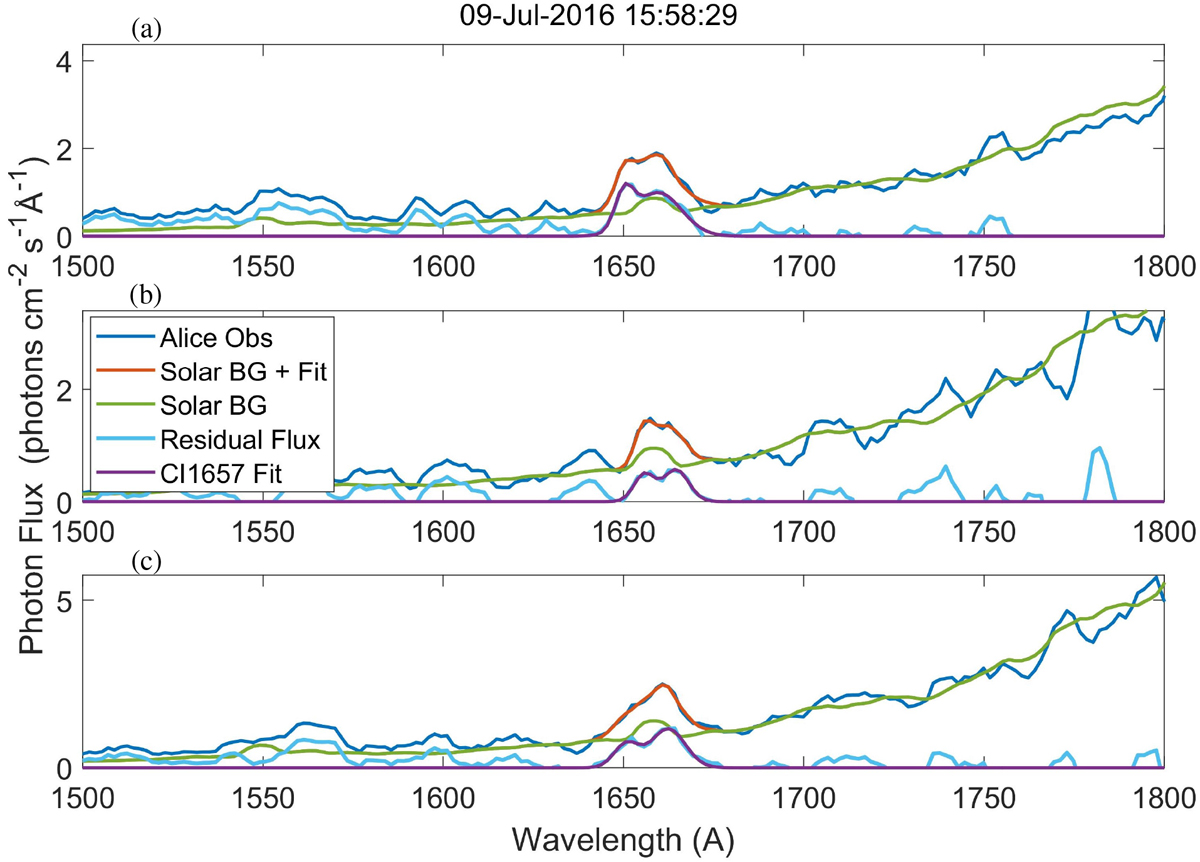
Breakdown of the fitting procedure to retrieve the CI1657 and CO4PG line brightness for Rows 8–11 (a), Rows 13–16 (b) and Rows 18–21 (c). The solar spectrum from TIMED-SEE (green) is smoothed and then scaled to the Alice photon flux (dark blue) at long wavelengths. The residual observed flux, once the solar spectrum is subtracted, is shown in light blue and with the CI1657 fit plotted in purple. The combination of the solar background with the CI1657 line fit is plotted in orange.
Current usage metrics show cumulative count of Article Views (full-text article views including HTML views, PDF and ePub downloads, according to the available data) and Abstracts Views on Vision4Press platform.
Data correspond to usage on the plateform after 2015. The current usage metrics is available 48-96 hours after online publication and is updated daily on week days.
Initial download of the metrics may take a while.