Fig. 7.
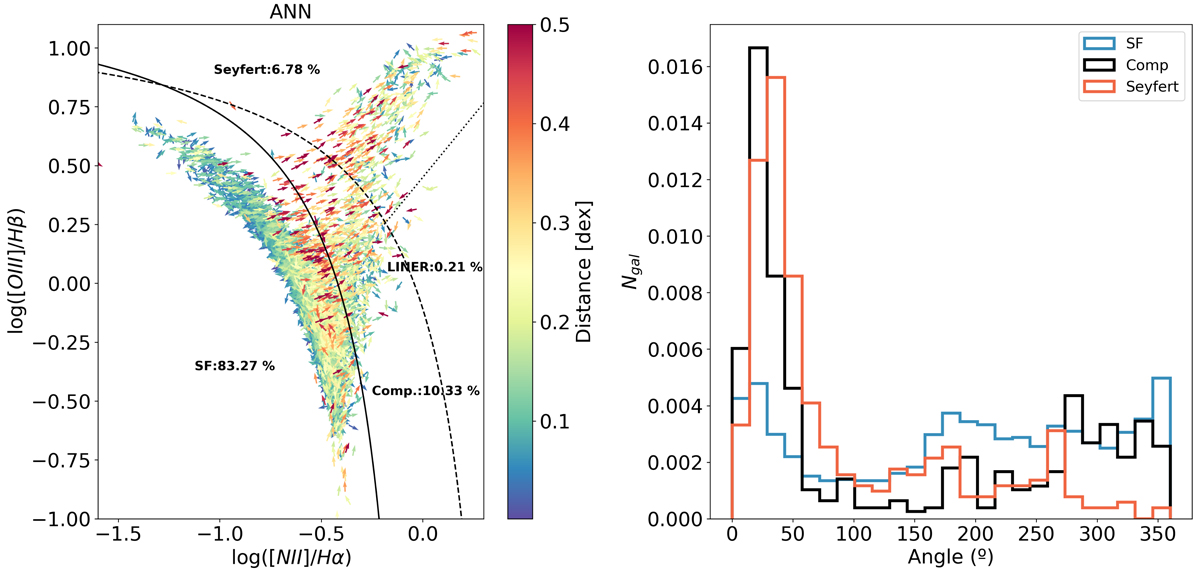
BPT diagram obtained by the ANNR trained with the CALMa set. Arrows point in the direction towards the location where galaxies should be placed according to their position in the SDSS MPA-JHU DR8 catalog. The color represents the distance for each point between the two BPT diagrams. The solid (ka03), dashed (Ke01) and dotted lines (S07) define the regions for the four main ionization mechanisms of galaxies. The percentage for each group is shown in black. The histograms on the rights represent the angular distribution of the arrows for Star forming, Seyfert and composite galaxies. The angle is defined as a clockwise rotation towards the x axis.
Current usage metrics show cumulative count of Article Views (full-text article views including HTML views, PDF and ePub downloads, according to the available data) and Abstracts Views on Vision4Press platform.
Data correspond to usage on the plateform after 2015. The current usage metrics is available 48-96 hours after online publication and is updated daily on week days.
Initial download of the metrics may take a while.