Fig. 6.
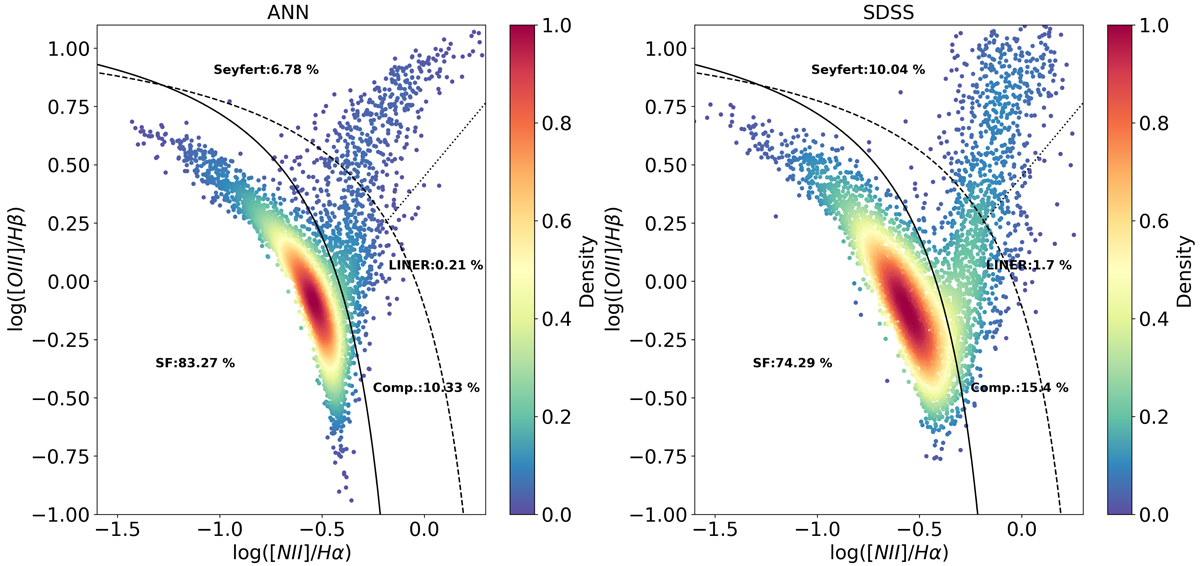
BPT diagram obtained with the ANNR and SDSS testing sample from the MPA-JHU DR8 catalog. The ANNR is trained with the CALMa set. The color-code indicates the density of points. The solid (ka03), dashed (Ke01) and dotted lines (S07) define the regions for the four main ionization mechanism of galaxies. The percentage for each group is shown in black.
Current usage metrics show cumulative count of Article Views (full-text article views including HTML views, PDF and ePub downloads, according to the available data) and Abstracts Views on Vision4Press platform.
Data correspond to usage on the plateform after 2015. The current usage metrics is available 48-96 hours after online publication and is updated daily on week days.
Initial download of the metrics may take a while.