Fig. 4.
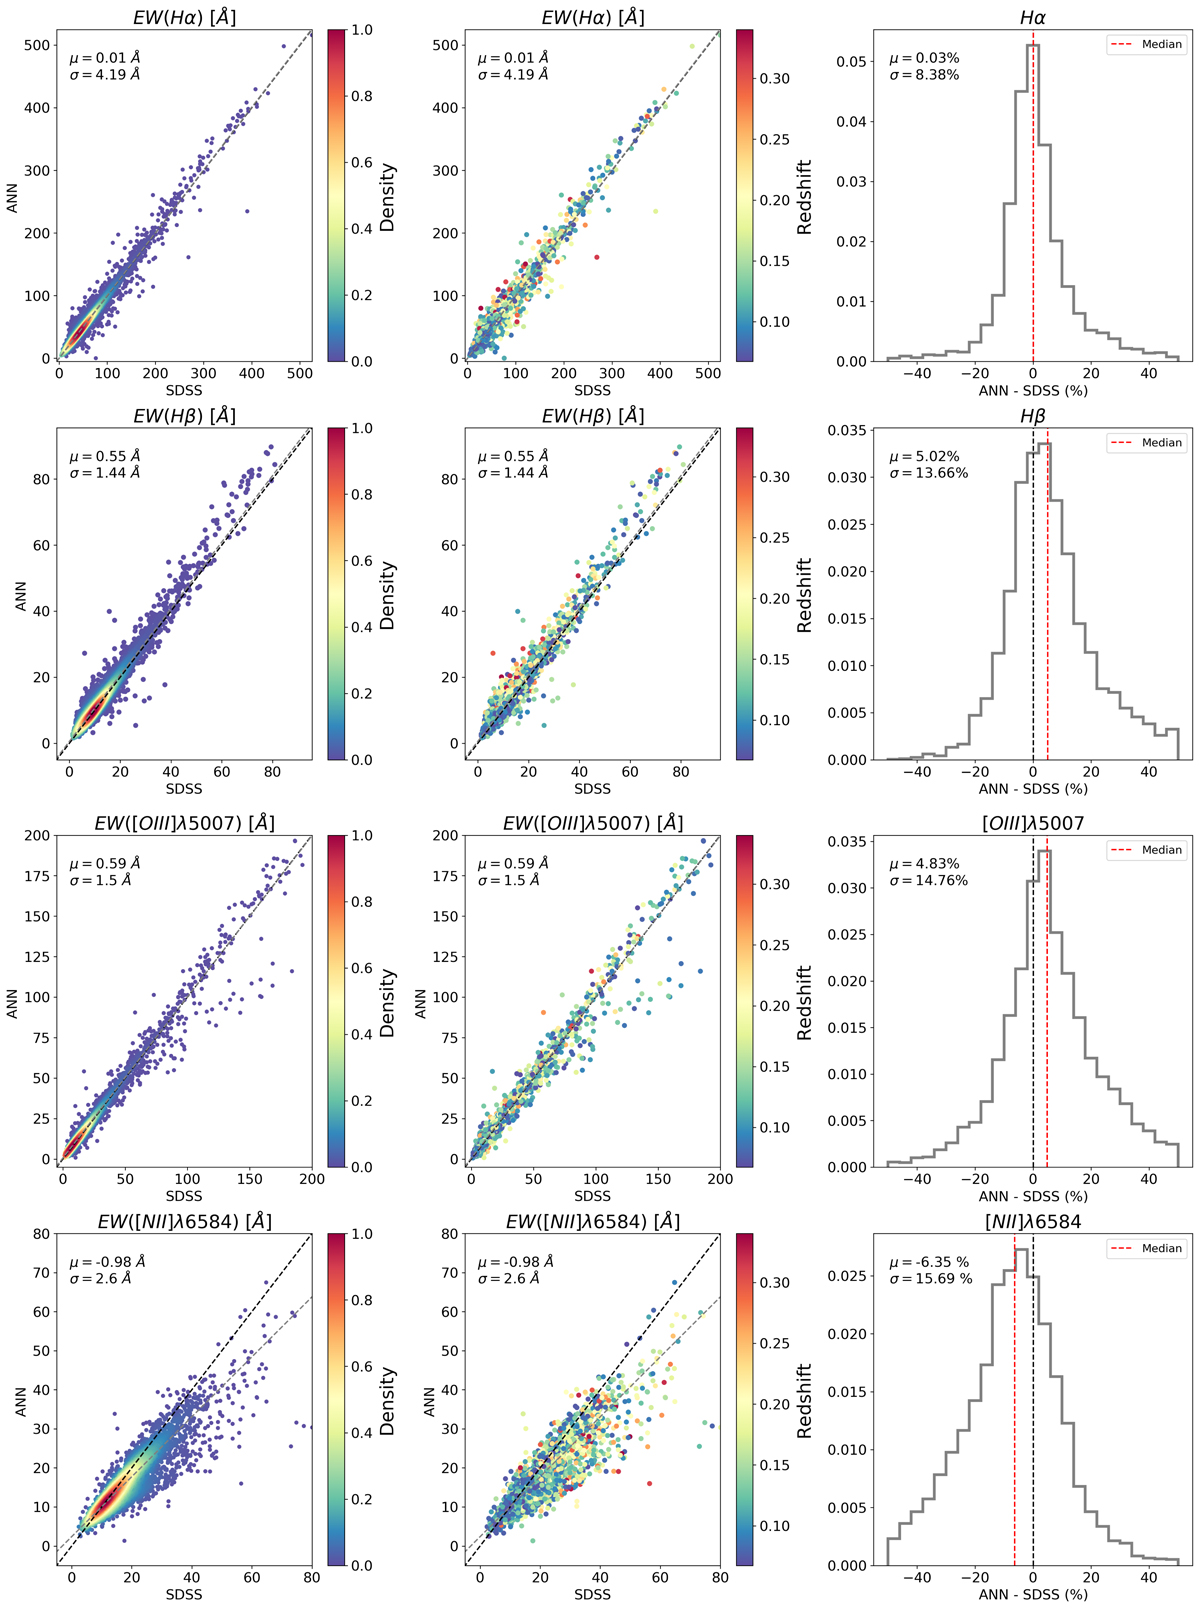
EWs of Hα, Hβ, [N II] and [O III] predicted by the ANNR compared to SDSS testing sample. The ANNR is trained with the CALMa set. The color-code represents the probability density function defined by a Gaussian kernel (right panel) and the redshift of the objects (left panel). The histograms in are normalized to one and show the relative difference between both values. Black and blue numbers are the median and the median absolute deviation of the difference. Black and grey dashed lines on the left are lines with slope one and the best linear fit respectively. We perform a sigma clipping fit with σ = 3 to exclude outliers. The red dashed line represents the median.
Current usage metrics show cumulative count of Article Views (full-text article views including HTML views, PDF and ePub downloads, according to the available data) and Abstracts Views on Vision4Press platform.
Data correspond to usage on the plateform after 2015. The current usage metrics is available 48-96 hours after online publication and is updated daily on week days.
Initial download of the metrics may take a while.