Fig. 12.
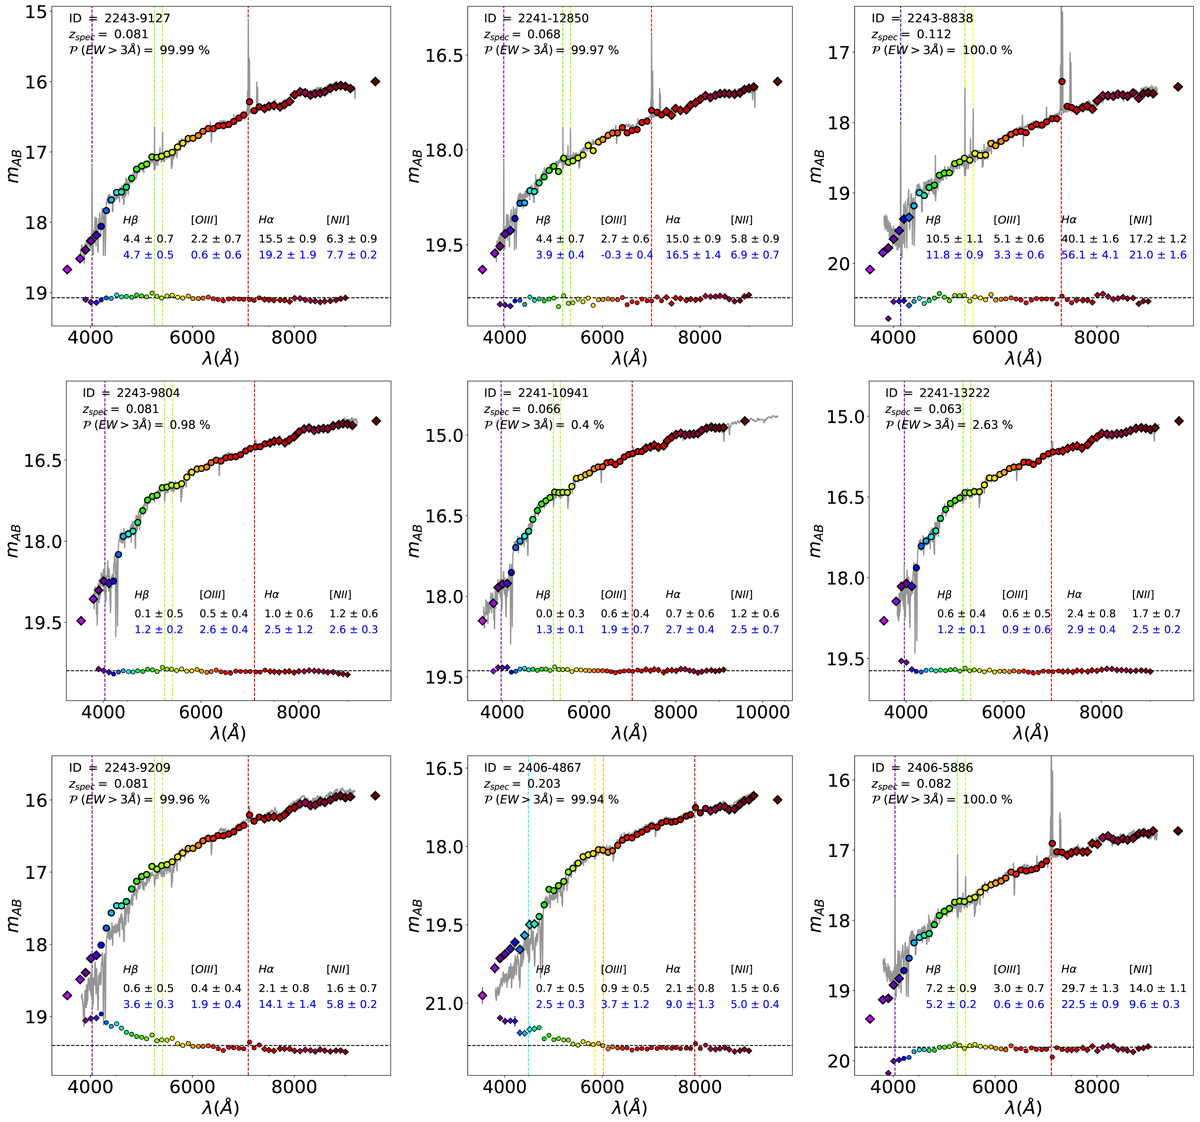
Examples of J-PAS galaxies in the AEGIS field with SDSS spectrum. The SDSS spectrum is re-scaled to match the rSDSS J-PAS magnitude. Diamonds correspond to the filters not used by the ANN. Blue and black numbers show, respectively, the predictions made by the ANNR on the EWs and the values measured in the SDSS spectrum. On the top-left part of the plot, we indicate the J-PAS ID of the object, its redshift and the prediction of the ANNC for EWmin = 3 Å. At the bottom, we show the difference in magnitude between the synthetic fluxes obtained from SDSS spectra and J-PAS data. Dashed lines mark from left to right the position of [O II], Hβ, [O III], and Hα emission lines.
Current usage metrics show cumulative count of Article Views (full-text article views including HTML views, PDF and ePub downloads, according to the available data) and Abstracts Views on Vision4Press platform.
Data correspond to usage on the plateform after 2015. The current usage metrics is available 48-96 hours after online publication and is updated daily on week days.
Initial download of the metrics may take a while.