Fig. 11.
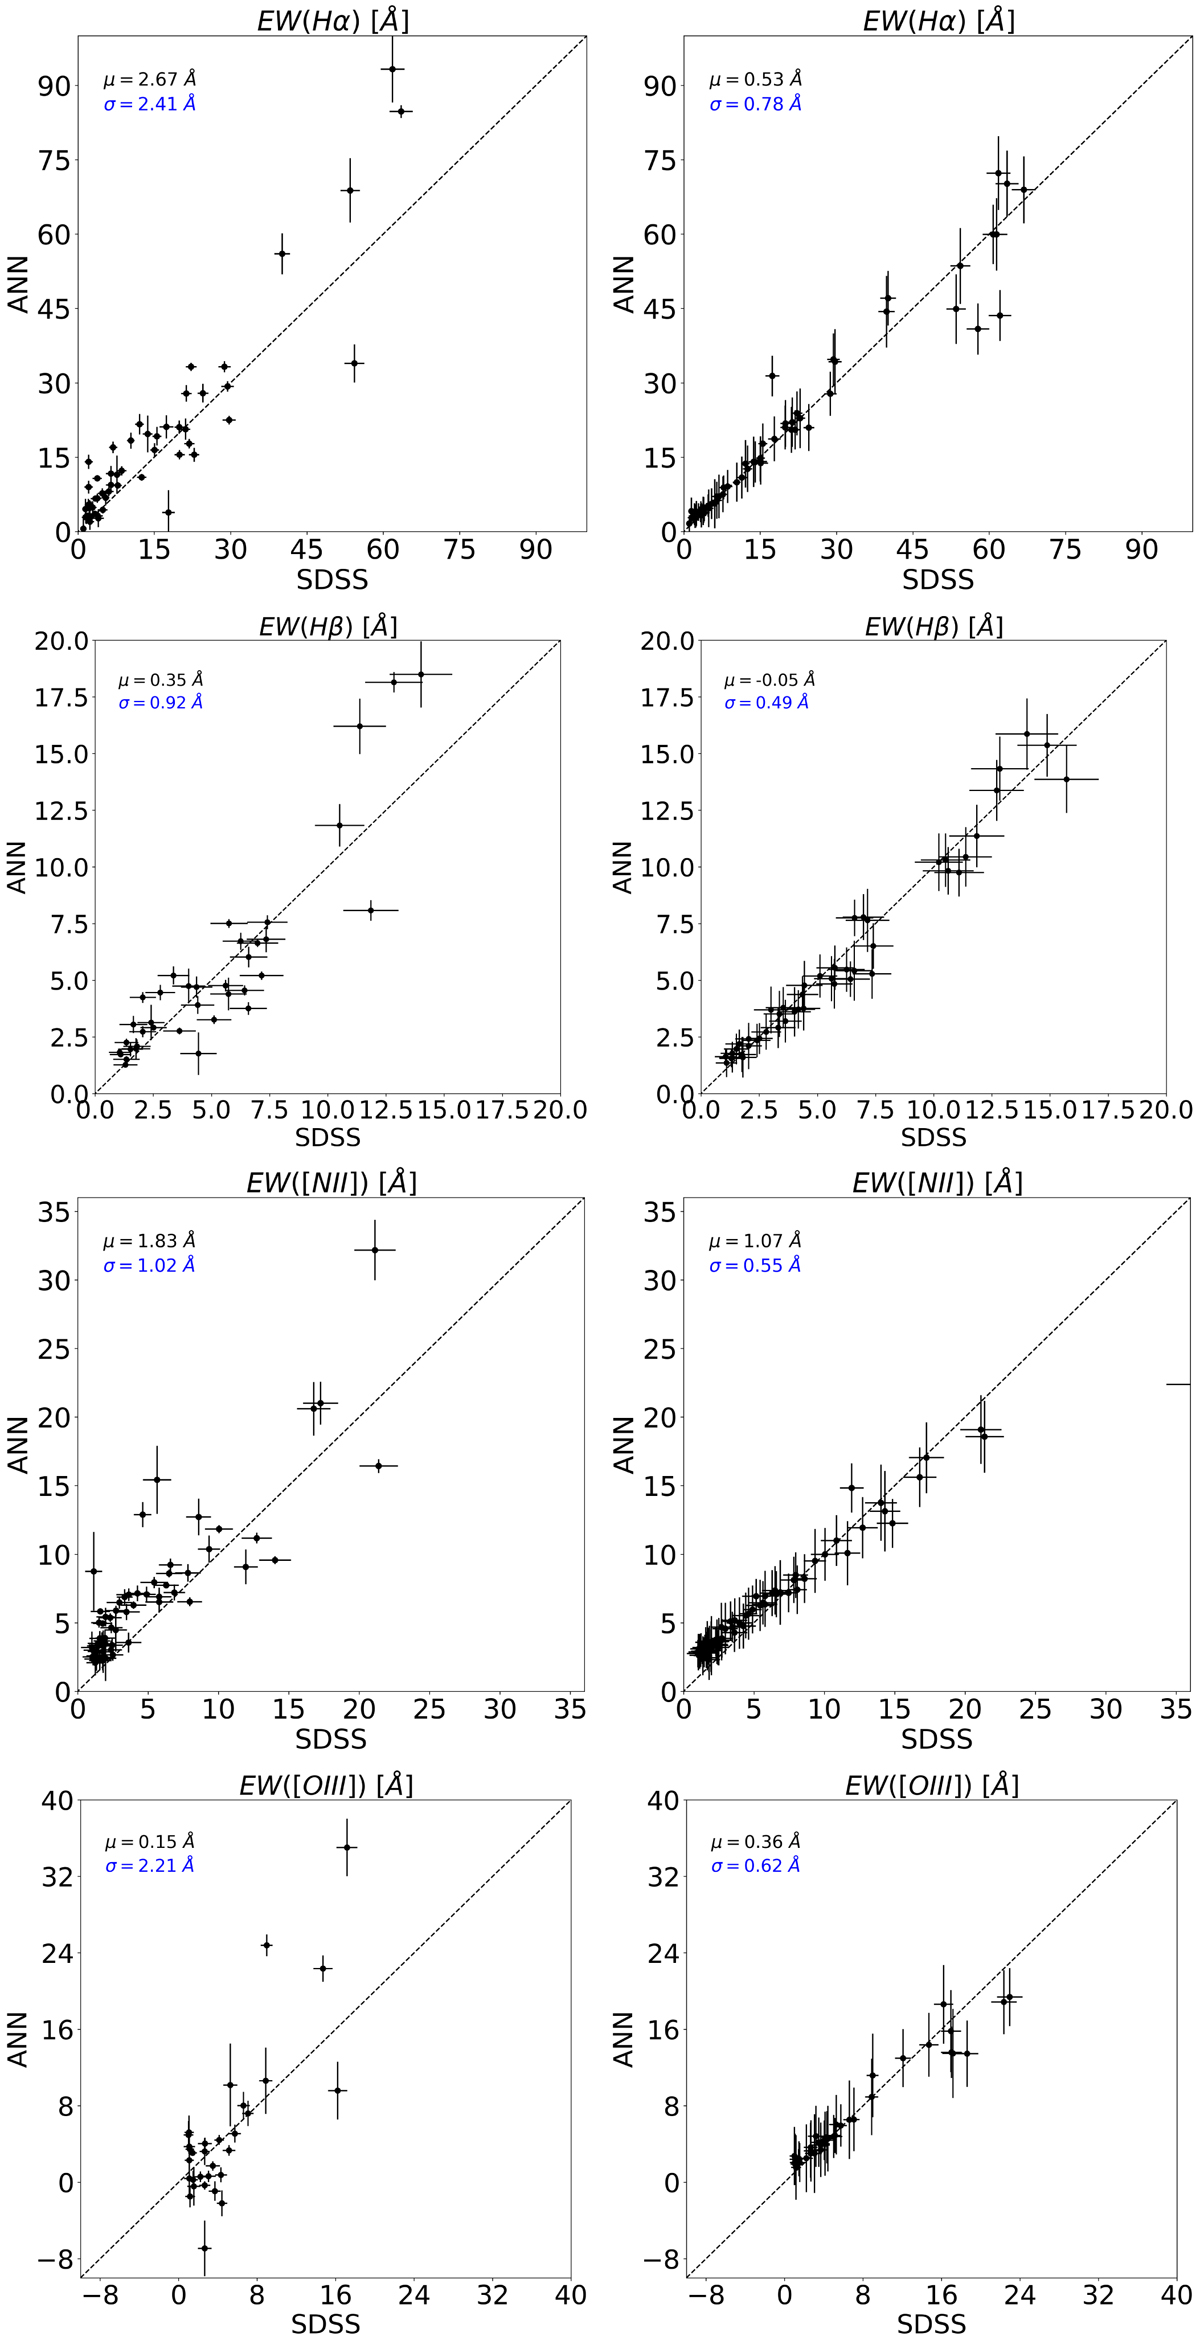
Comparison between the EWs of Hα, [N II], Hβ and [O III] measured in the SDSS spectra and the predictions made by the ANN on miniJPAS data using the MAG PSFCOR (left panel) and synthetic J-PAS magnitudes obtained from the SDSS spectra (right panel). Black and blue numbers are the median and the median absolute deviation of the difference. Dashed black line is line with slope one.
Current usage metrics show cumulative count of Article Views (full-text article views including HTML views, PDF and ePub downloads, according to the available data) and Abstracts Views on Vision4Press platform.
Data correspond to usage on the plateform after 2015. The current usage metrics is available 48-96 hours after online publication and is updated daily on week days.
Initial download of the metrics may take a while.