Fig. 10.
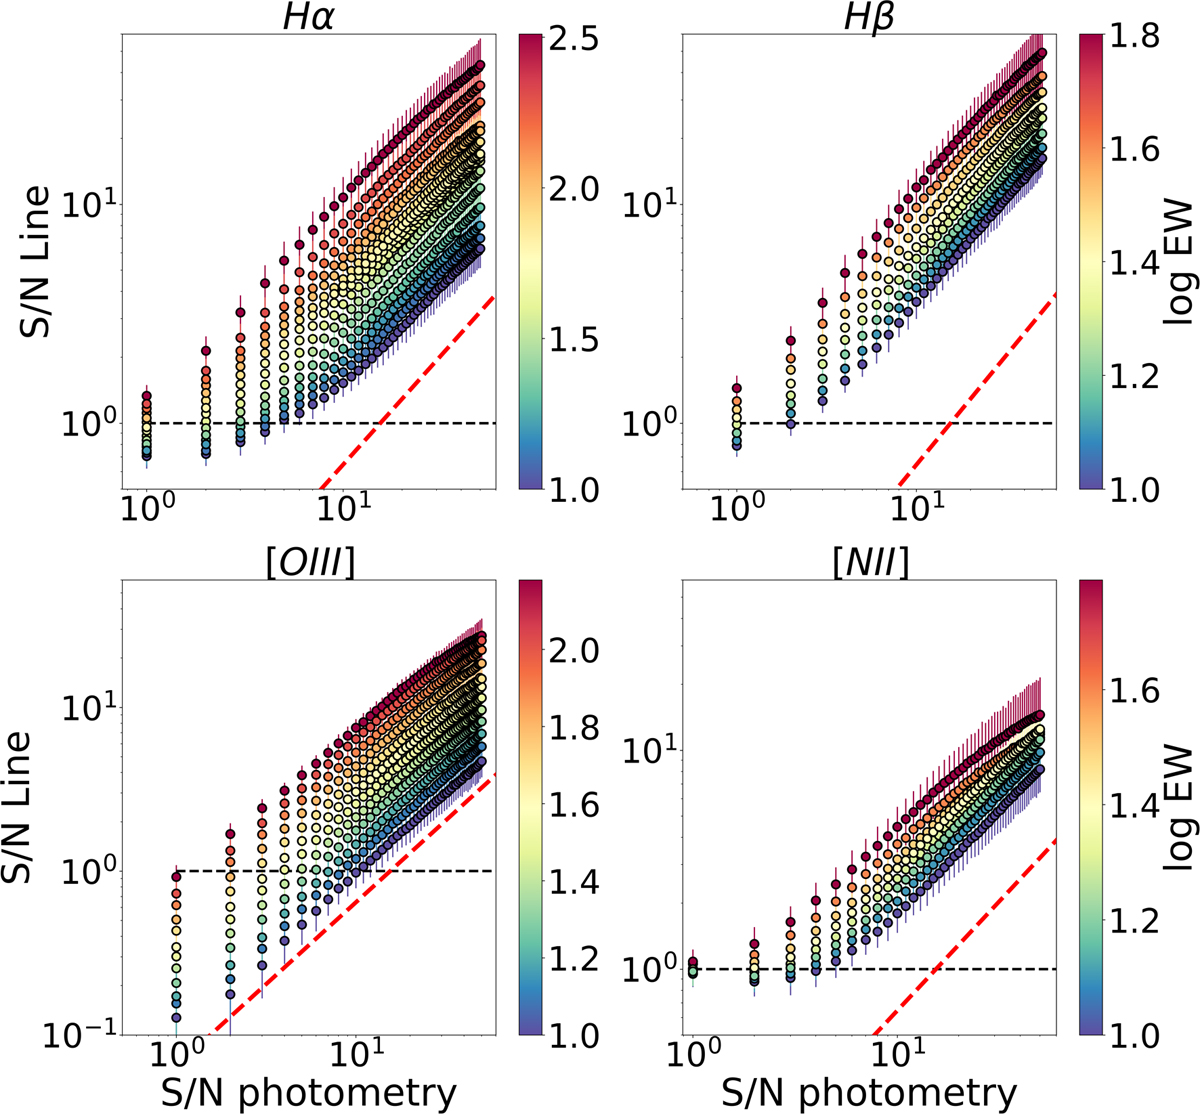
Predicted S/N of Hα, Hβ, [O III] and [N II] lines in function of the S/N in the photometry. For a given S/N in the photometry, each point represent the mean S/N obtained in the line for 500 SDSS galaxies in the interval (color-coded) γ < logEWSDSS < γ + 0.1 with γ ranging from 0.8 to 2.5 for Hα, from 0.8 to 2.2 for [O III], from 0.8 to 1.8 for Hβ and from 0.8 to 1.8 for [N II]. Errors bars indicate the mean absolute deviation. Dashed red line represents Eq. (5) for EW = 10 Å.
Current usage metrics show cumulative count of Article Views (full-text article views including HTML views, PDF and ePub downloads, according to the available data) and Abstracts Views on Vision4Press platform.
Data correspond to usage on the plateform after 2015. The current usage metrics is available 48-96 hours after online publication and is updated daily on week days.
Initial download of the metrics may take a while.