Free Access
Fig. 6.
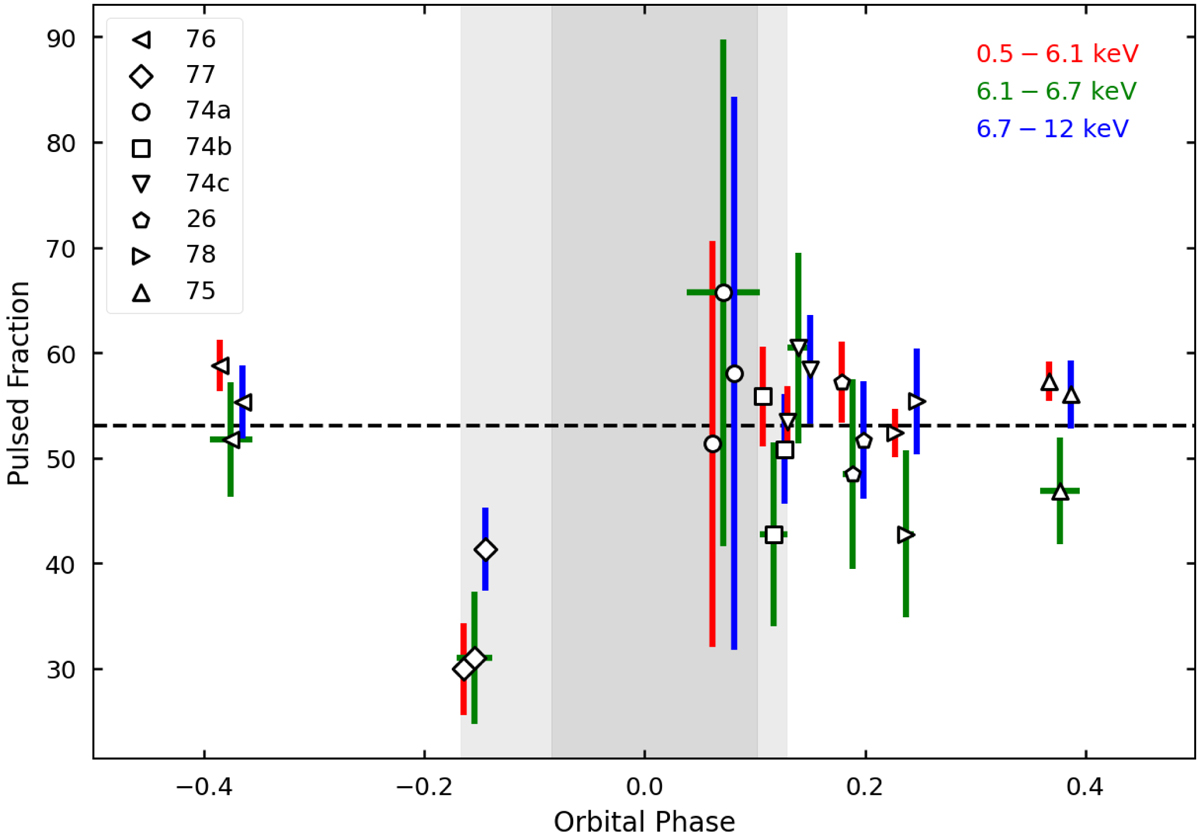
Pulsed fraction (definition in text) for each observation calculated in 3 energy bands. Light curves used were folded with the best spin period found according to Fig. 2. The dashed horizontal line corresponds to the out-of-eclipse average value of 53 ± 5%.
Current usage metrics show cumulative count of Article Views (full-text article views including HTML views, PDF and ePub downloads, according to the available data) and Abstracts Views on Vision4Press platform.
Data correspond to usage on the plateform after 2015. The current usage metrics is available 48-96 hours after online publication and is updated daily on week days.
Initial download of the metrics may take a while.