Fig. 1.
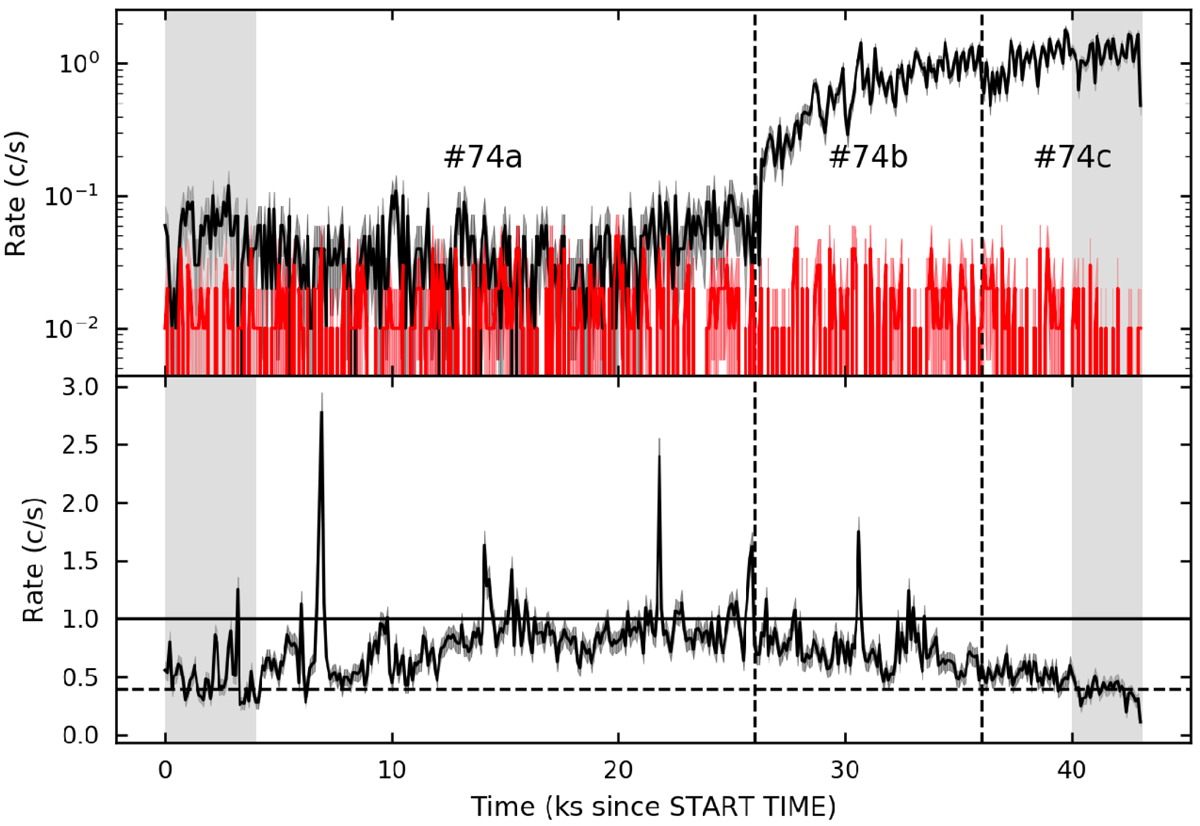
Source and background light curves of the eclipse observation #74 using 100 s bins. Top panel: source+background (black) and background (red) light curves extracted in the 0.5–12 keV energy range using circular regions with equal area. Bottom panel: full CCD light curve in the 10–12 keV energy range excluding the source region. The black vertical lines indicate split times for eclipse (a), egress (b), and out-of-eclipse (c) periods, according to (Coley et al. 2015) ephemeris. The full (dashed) horizontal line corresponds to the background rate of 1 cps (0.4 cps).
Current usage metrics show cumulative count of Article Views (full-text article views including HTML views, PDF and ePub downloads, according to the available data) and Abstracts Views on Vision4Press platform.
Data correspond to usage on the plateform after 2015. The current usage metrics is available 48-96 hours after online publication and is updated daily on week days.
Initial download of the metrics may take a while.