Fig. 9.
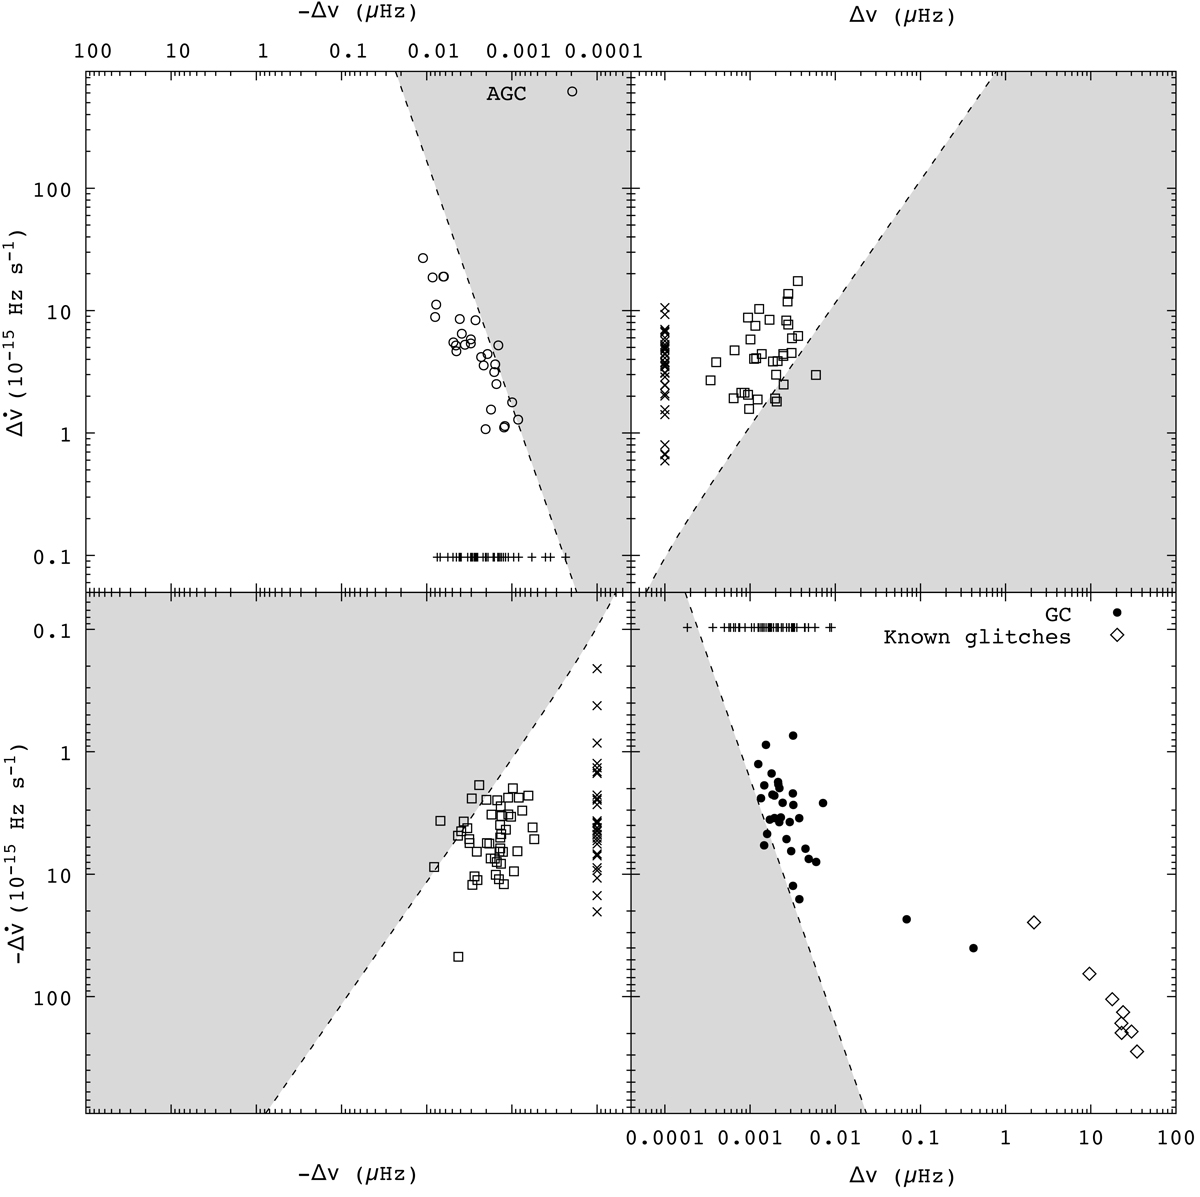
Sizes of all the irregularities selected for all possible combinations of signs for Δν and ![]() , including cases in which one of the parameters was not detected (Δν = 0 or
, including cases in which one of the parameters was not detected (Δν = 0 or ![]() , which are plotted as crosses and the letter x, respectively). These results are for Nd = 10, and the known Vela glitches in the dataset were measured as for Fig. 2. The straight lines represent detection limits (no events expected in the shaded areas), as explained in Sect. 6.
, which are plotted as crosses and the letter x, respectively). These results are for Nd = 10, and the known Vela glitches in the dataset were measured as for Fig. 2. The straight lines represent detection limits (no events expected in the shaded areas), as explained in Sect. 6.
Current usage metrics show cumulative count of Article Views (full-text article views including HTML views, PDF and ePub downloads, according to the available data) and Abstracts Views on Vision4Press platform.
Data correspond to usage on the plateform after 2015. The current usage metrics is available 48-96 hours after online publication and is updated daily on week days.
Initial download of the metrics may take a while.