Fig. 8.
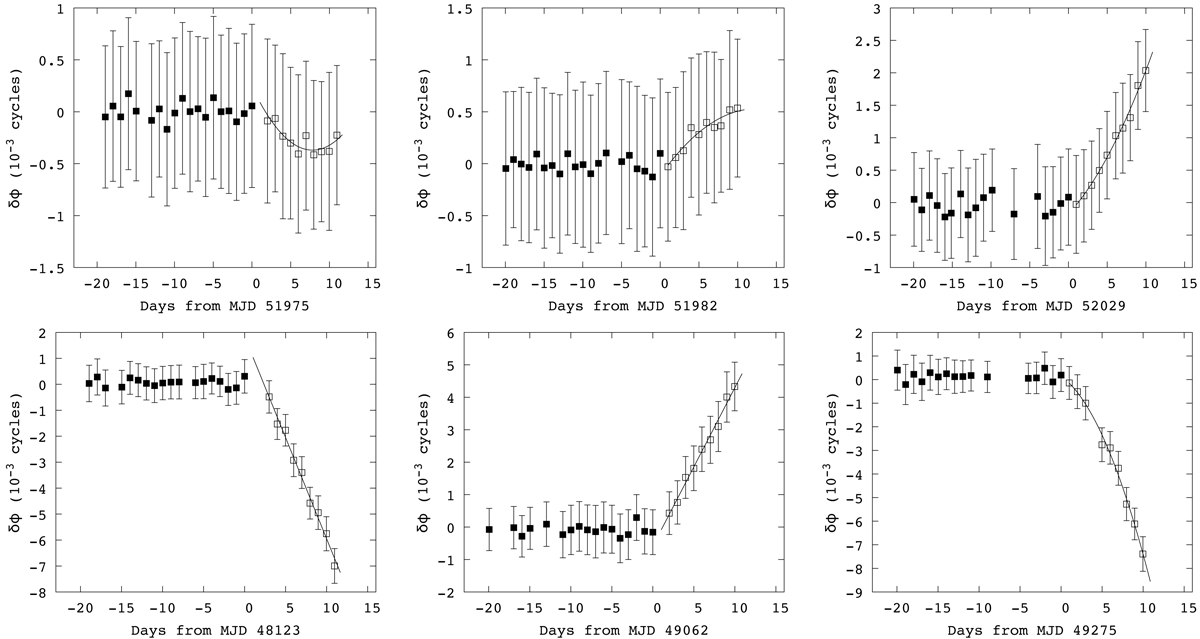
Examples of two GCs (Δν > 0, ![]() ; left most panels), two AGCs (Δν < 0,
; left most panels), two AGCs (Δν < 0, ![]() ; centre), and two events in which Δν = 0 and
; centre), and two events in which Δν = 0 and ![]() (top right) or
(top right) or ![]() (bottom right). The phase residuals are plotted with respect to a fit of TOAs up to the event epoch t = 0. The phase residuals for the first set are shown with filled squares, and for the second set, they are shown with empty squares. The continuous lines represent the best model for the second set (Eq. (2)). For the two cases in the left (left and middle columns) the event at the bottom has a |Δν| that is much larger than the case at the top. Similarly, for the third column, the case at the bottom has a much larger
(bottom right). The phase residuals are plotted with respect to a fit of TOAs up to the event epoch t = 0. The phase residuals for the first set are shown with filled squares, and for the second set, they are shown with empty squares. The continuous lines represent the best model for the second set (Eq. (2)). For the two cases in the left (left and middle columns) the event at the bottom has a |Δν| that is much larger than the case at the top. Similarly, for the third column, the case at the bottom has a much larger ![]() than the case at the top.
than the case at the top.
Current usage metrics show cumulative count of Article Views (full-text article views including HTML views, PDF and ePub downloads, according to the available data) and Abstracts Views on Vision4Press platform.
Data correspond to usage on the plateform after 2015. The current usage metrics is available 48-96 hours after online publication and is updated daily on week days.
Initial download of the metrics may take a while.