Fig. 6.
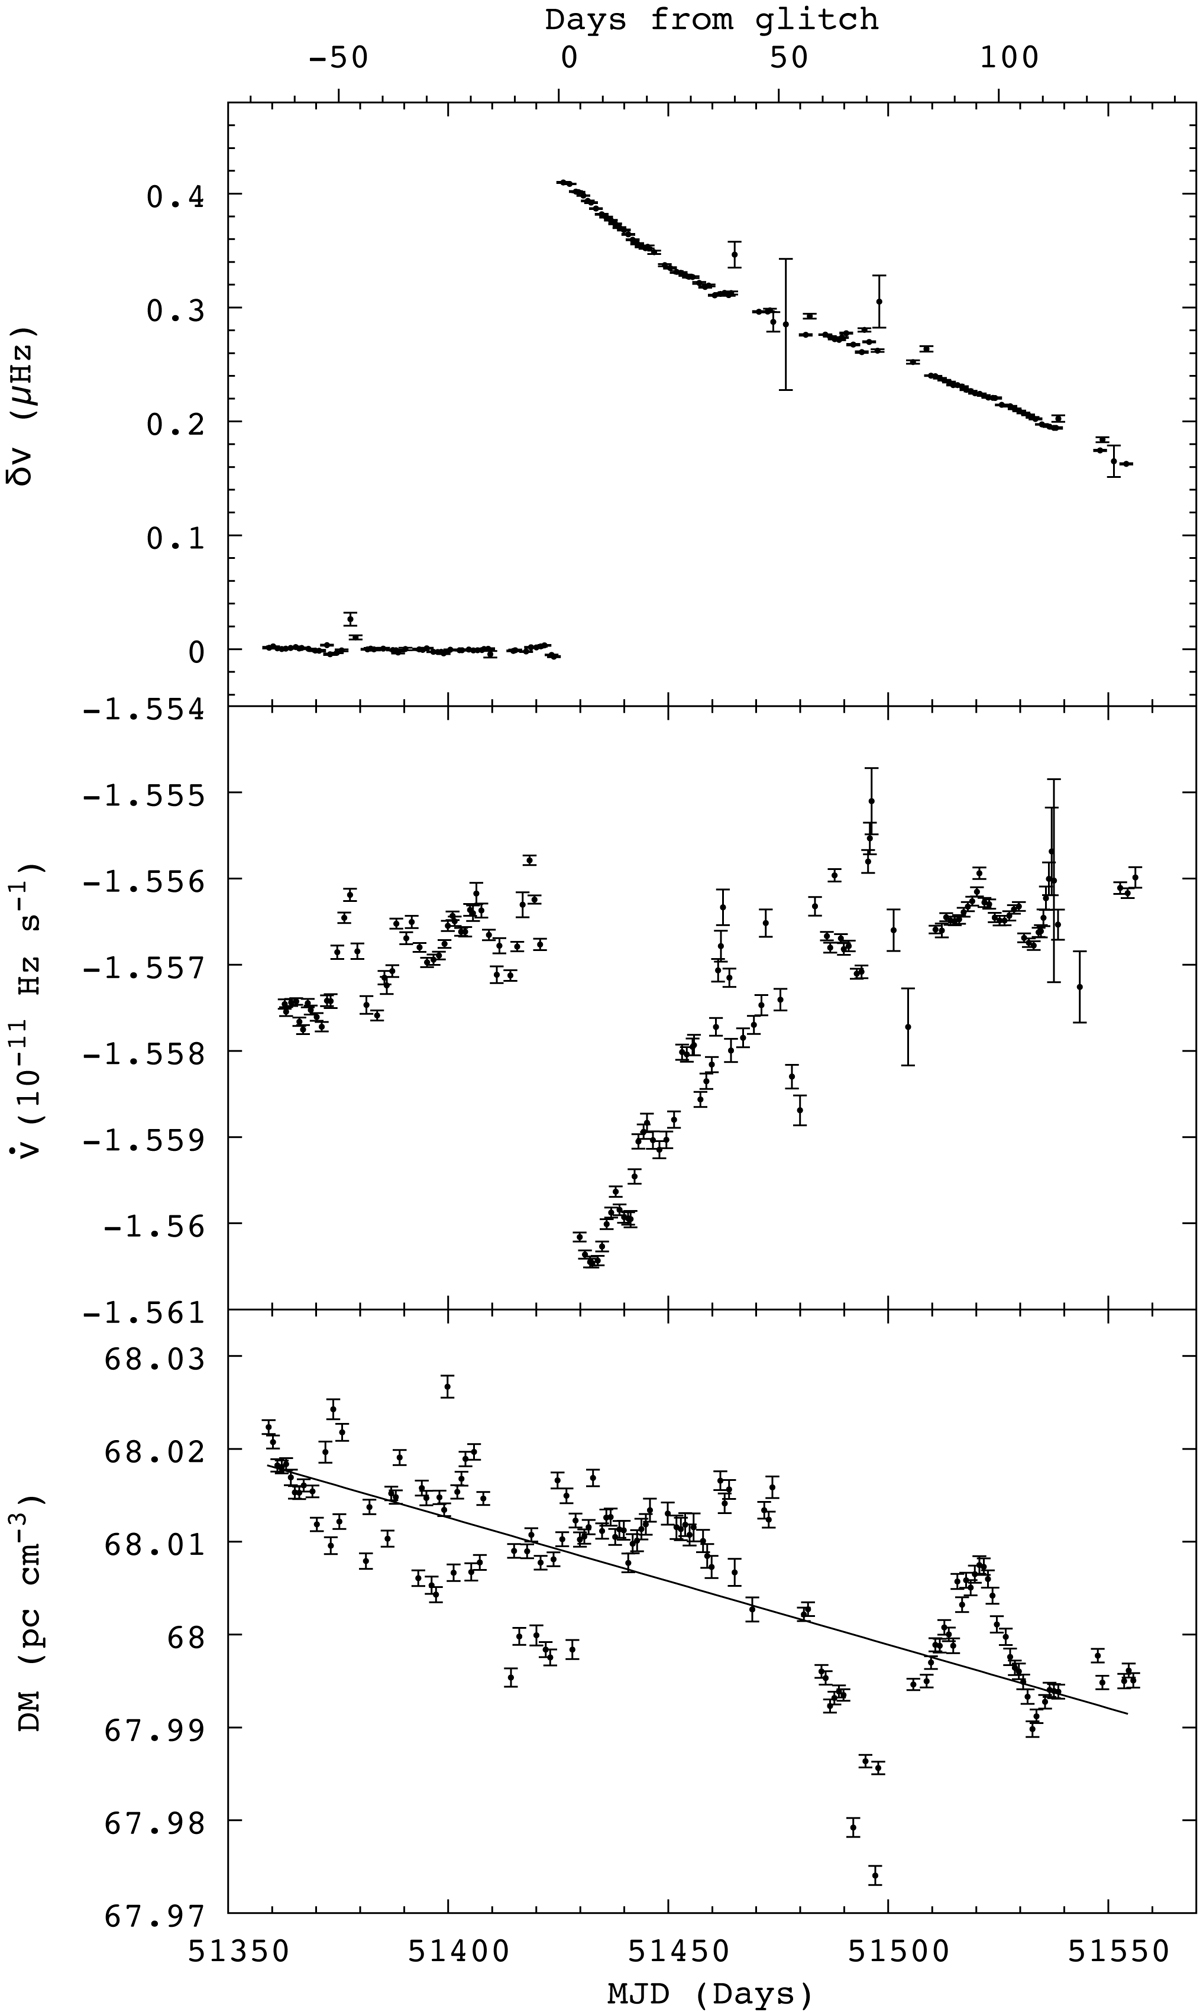
Rotational behaviour and DM evolution around the new glitch at MJD 51425.12. Top: frequency residuals relative to a quadratic model fitted to ν data before the glitch. Middle: spin-down rate ![]() . Both ν and
. Both ν and ![]() values were measured as in Fig. 4. Large error bars are normally produced by gaps in the set of TOAs. Bottom: dispersion measure and the model used to describe its variation around the glitch.
values were measured as in Fig. 4. Large error bars are normally produced by gaps in the set of TOAs. Bottom: dispersion measure and the model used to describe its variation around the glitch.
Current usage metrics show cumulative count of Article Views (full-text article views including HTML views, PDF and ePub downloads, according to the available data) and Abstracts Views on Vision4Press platform.
Data correspond to usage on the plateform after 2015. The current usage metrics is available 48-96 hours after online publication and is updated daily on week days.
Initial download of the metrics may take a while.