Fig. 5.
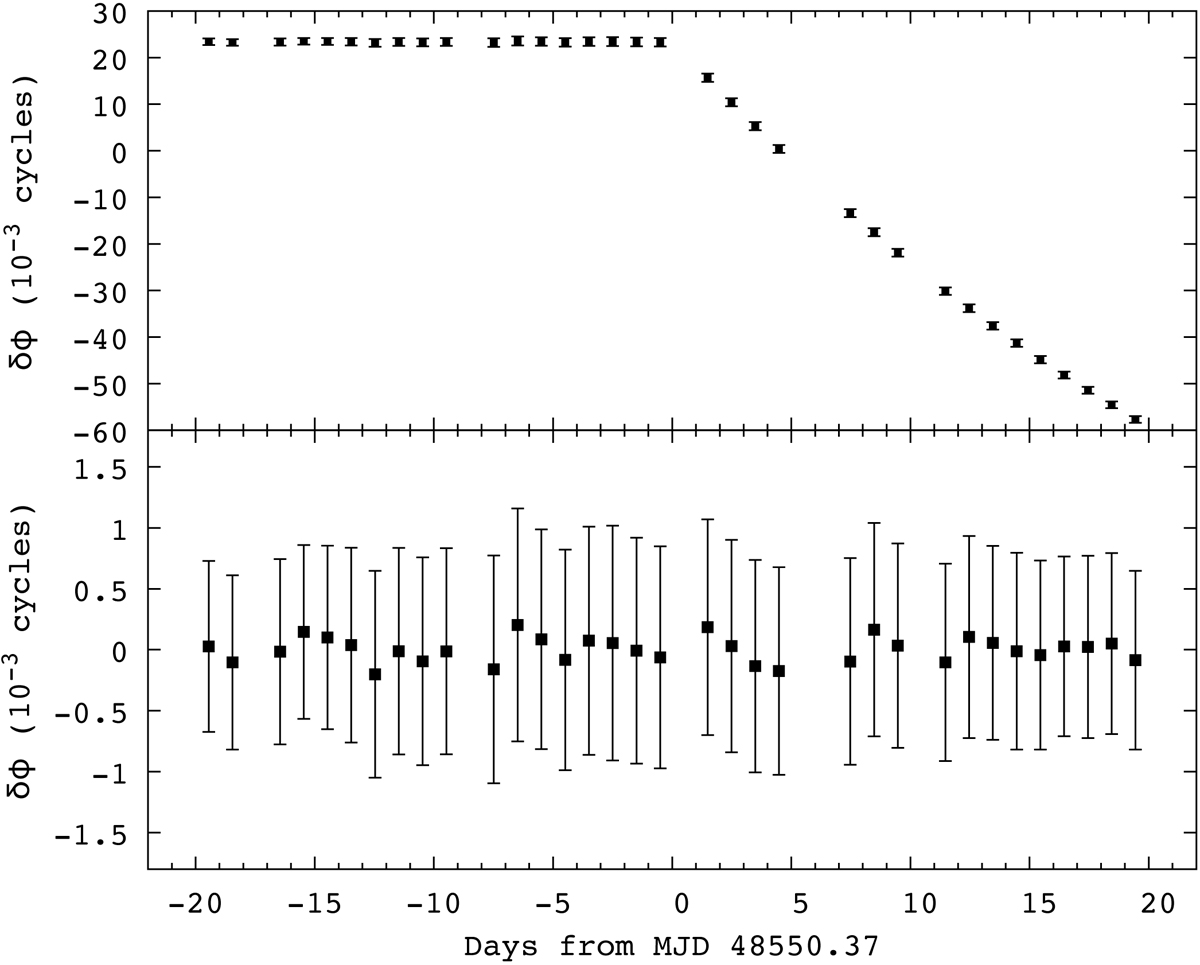
Phase residuals 40 d around the new small glitch at MJD 48550.37. Top: residuals relative to a model fitted to the 20 d of data prior to the glitch. Bottom: residuals relative to the glitch model in Table 2.
Current usage metrics show cumulative count of Article Views (full-text article views including HTML views, PDF and ePub downloads, according to the available data) and Abstracts Views on Vision4Press platform.
Data correspond to usage on the plateform after 2015. The current usage metrics is available 48-96 hours after online publication and is updated daily on week days.
Initial download of the metrics may take a while.