Fig. 4.
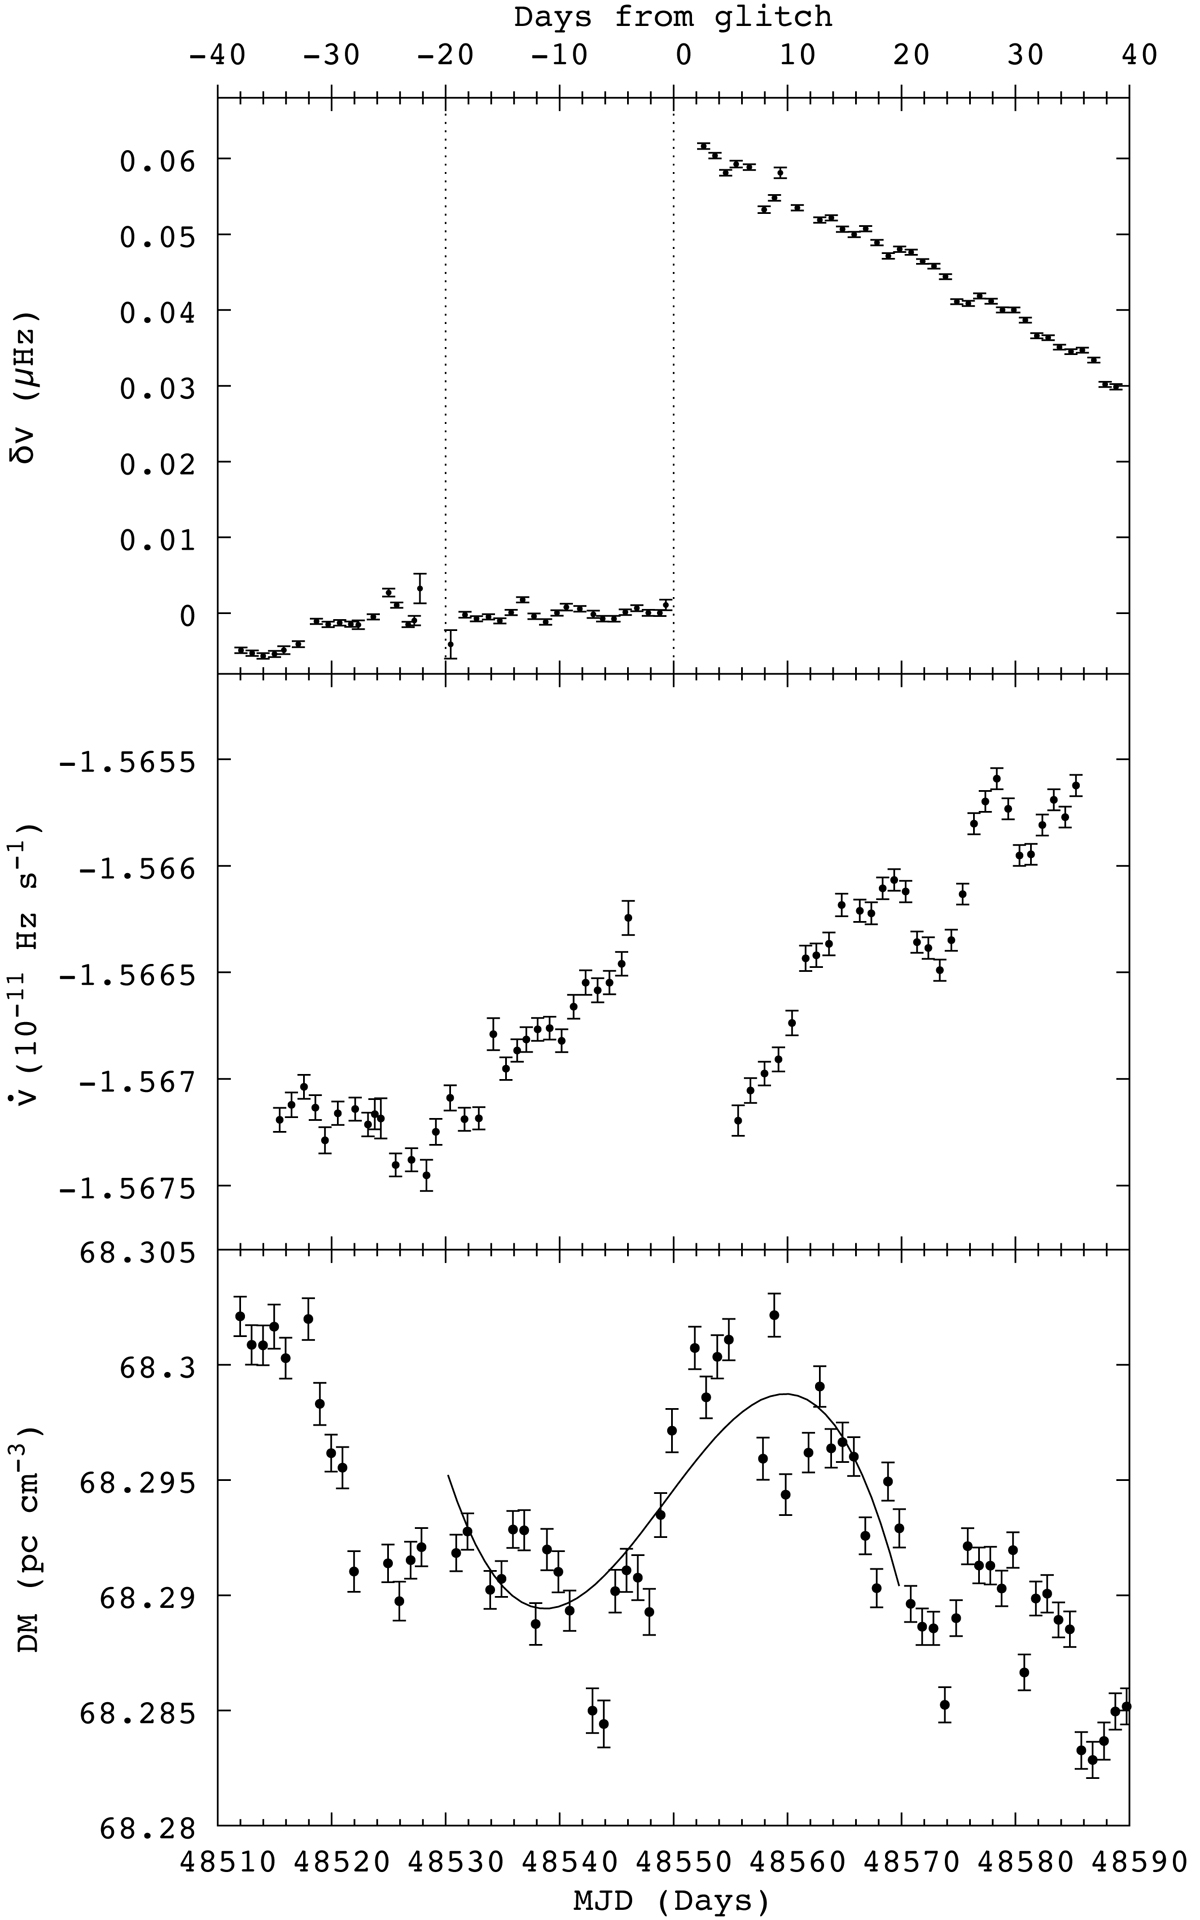
Rotational behaviour and DM evolution over 80 d around the new small glitch at MJD 48550.37. Top: frequency residuals relative to a quadratic model adjusted to ν data from 20 d before and up to the glitch epoch (interval marked by vertical dotted lines). The ν values come from fits to TOAs in a moving window 3 d long that moves by 1 d each stride. Middle: spin-down rate ![]() . Values come from fits to TOAs in a moving window of length 10 d and that moves 1 d with each stride. Windows that contained the glitch epoch were not considered, hence the gap in the plots. Bottom: daily values of the dispersion measure and the model we used to describe its variation for the 40 d around the glitch.
. Values come from fits to TOAs in a moving window of length 10 d and that moves 1 d with each stride. Windows that contained the glitch epoch were not considered, hence the gap in the plots. Bottom: daily values of the dispersion measure and the model we used to describe its variation for the 40 d around the glitch.
Current usage metrics show cumulative count of Article Views (full-text article views including HTML views, PDF and ePub downloads, according to the available data) and Abstracts Views on Vision4Press platform.
Data correspond to usage on the plateform after 2015. The current usage metrics is available 48-96 hours after online publication and is updated daily on week days.
Initial download of the metrics may take a while.