Fig. 2.
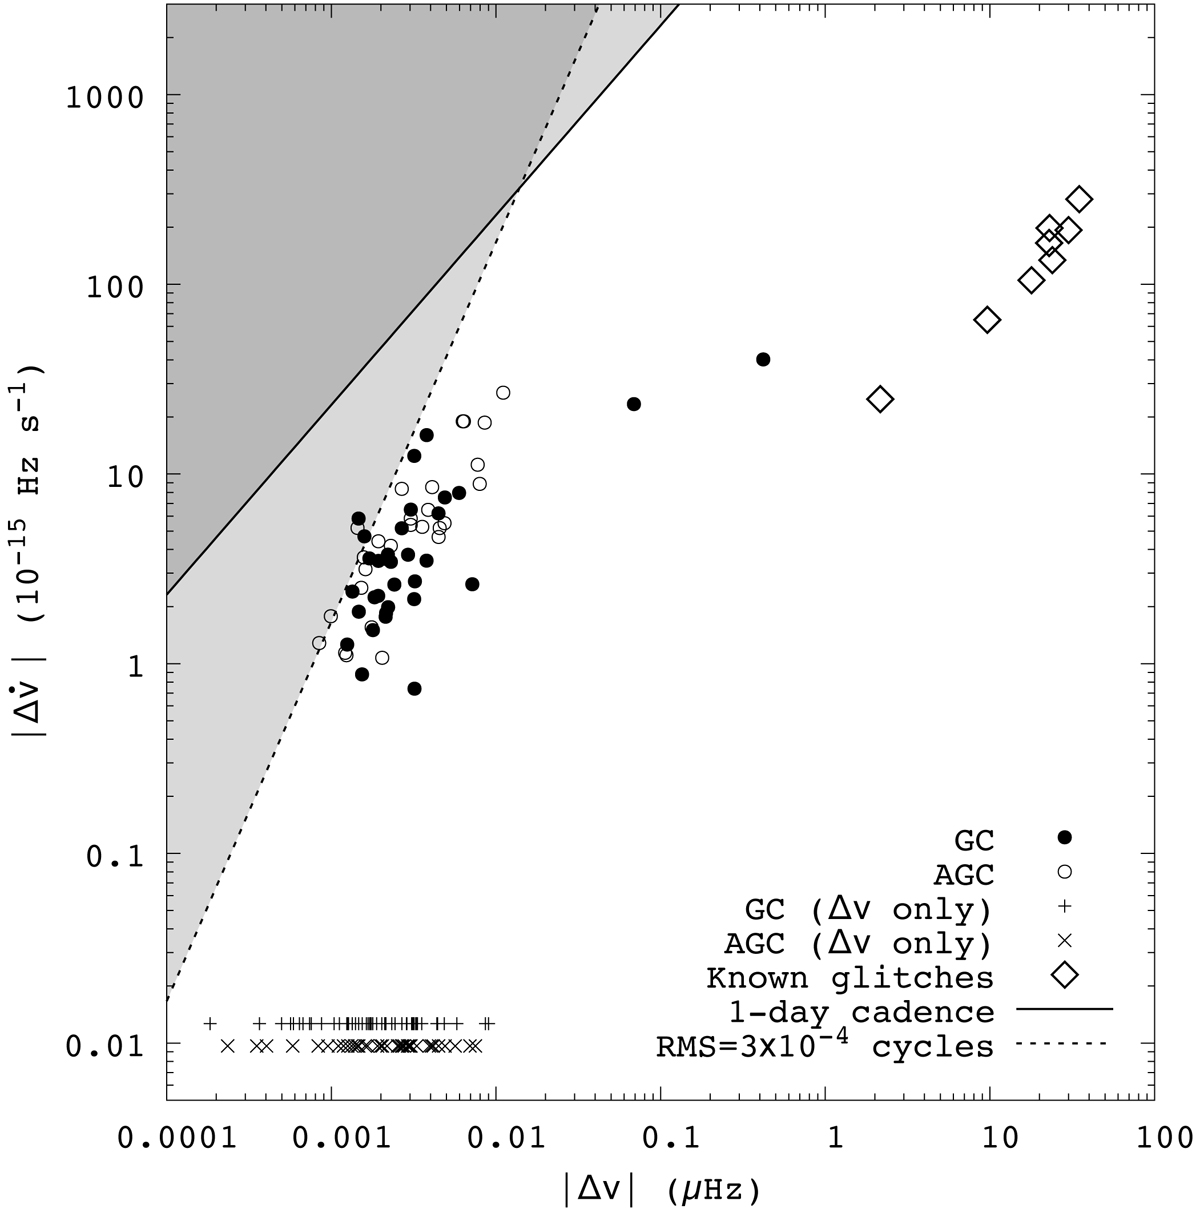
Selected GCs and AGCs for Nd = 10 d. Candidates without detected ![]() are plotted with crosses and the letter x using artificially assigned fixed values of
are plotted with crosses and the letter x using artificially assigned fixed values of ![]() to place them at the bottom of the plot. Previously known Vela glitches that are in the dataset we used are plotted with diamonds. Straight lines indicate detection limits that depend upon cadence and noise. They indicate that detections above them are not expected. Error bars are omitted for clarity. The two new glitches we found are easily recognisable. They stand out as the GCs with the highest Δν values.
to place them at the bottom of the plot. Previously known Vela glitches that are in the dataset we used are plotted with diamonds. Straight lines indicate detection limits that depend upon cadence and noise. They indicate that detections above them are not expected. Error bars are omitted for clarity. The two new glitches we found are easily recognisable. They stand out as the GCs with the highest Δν values.
Current usage metrics show cumulative count of Article Views (full-text article views including HTML views, PDF and ePub downloads, according to the available data) and Abstracts Views on Vision4Press platform.
Data correspond to usage on the plateform after 2015. The current usage metrics is available 48-96 hours after online publication and is updated daily on week days.
Initial download of the metrics may take a while.