Fig. 10.
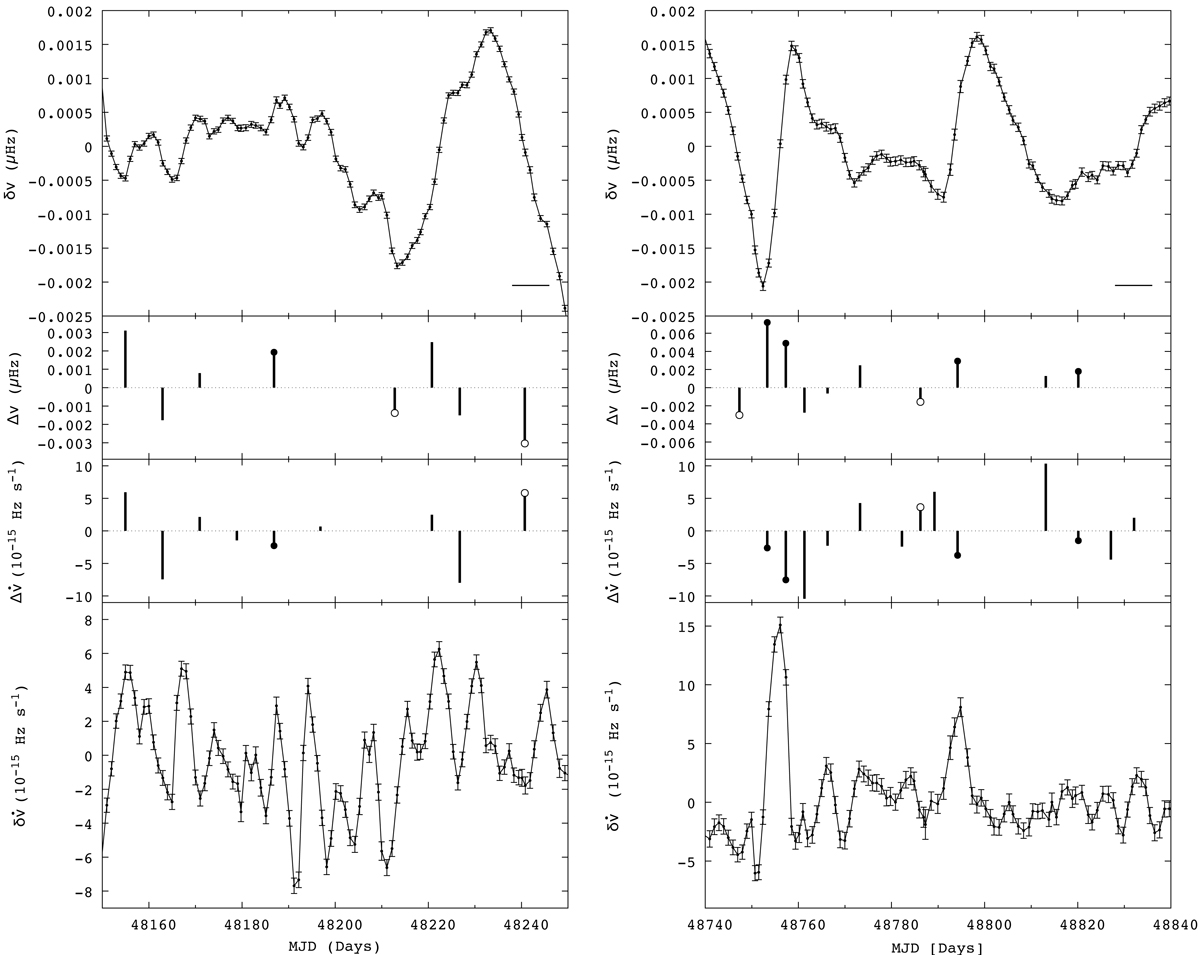
Examples of micro-irregularities in the rotational behaviour of the Vela pulsar and the events selected by the searches. Top: frequency residuals relative to a cubic model. Middle: two plots in the centre show the sizes Δν (top) and ![]() (bottom) of the GCs and AGCs (with filled and open circles, respectively, at the end of the bars) and of the other detected irregularities. Bottom: frequency derivative residuals relative to a linear model. The ν and
(bottom) of the GCs and AGCs (with filled and open circles, respectively, at the end of the bars) and of the other detected irregularities. Bottom: frequency derivative residuals relative to a linear model. The ν and ![]() datasets were obtained from fits to TOAs in a moving window 8 d long that moves by 1 d at each stride. The length of the horizontal line in the top panel is 8 d long.
datasets were obtained from fits to TOAs in a moving window 8 d long that moves by 1 d at each stride. The length of the horizontal line in the top panel is 8 d long.
Current usage metrics show cumulative count of Article Views (full-text article views including HTML views, PDF and ePub downloads, according to the available data) and Abstracts Views on Vision4Press platform.
Data correspond to usage on the plateform after 2015. The current usage metrics is available 48-96 hours after online publication and is updated daily on week days.
Initial download of the metrics may take a while.