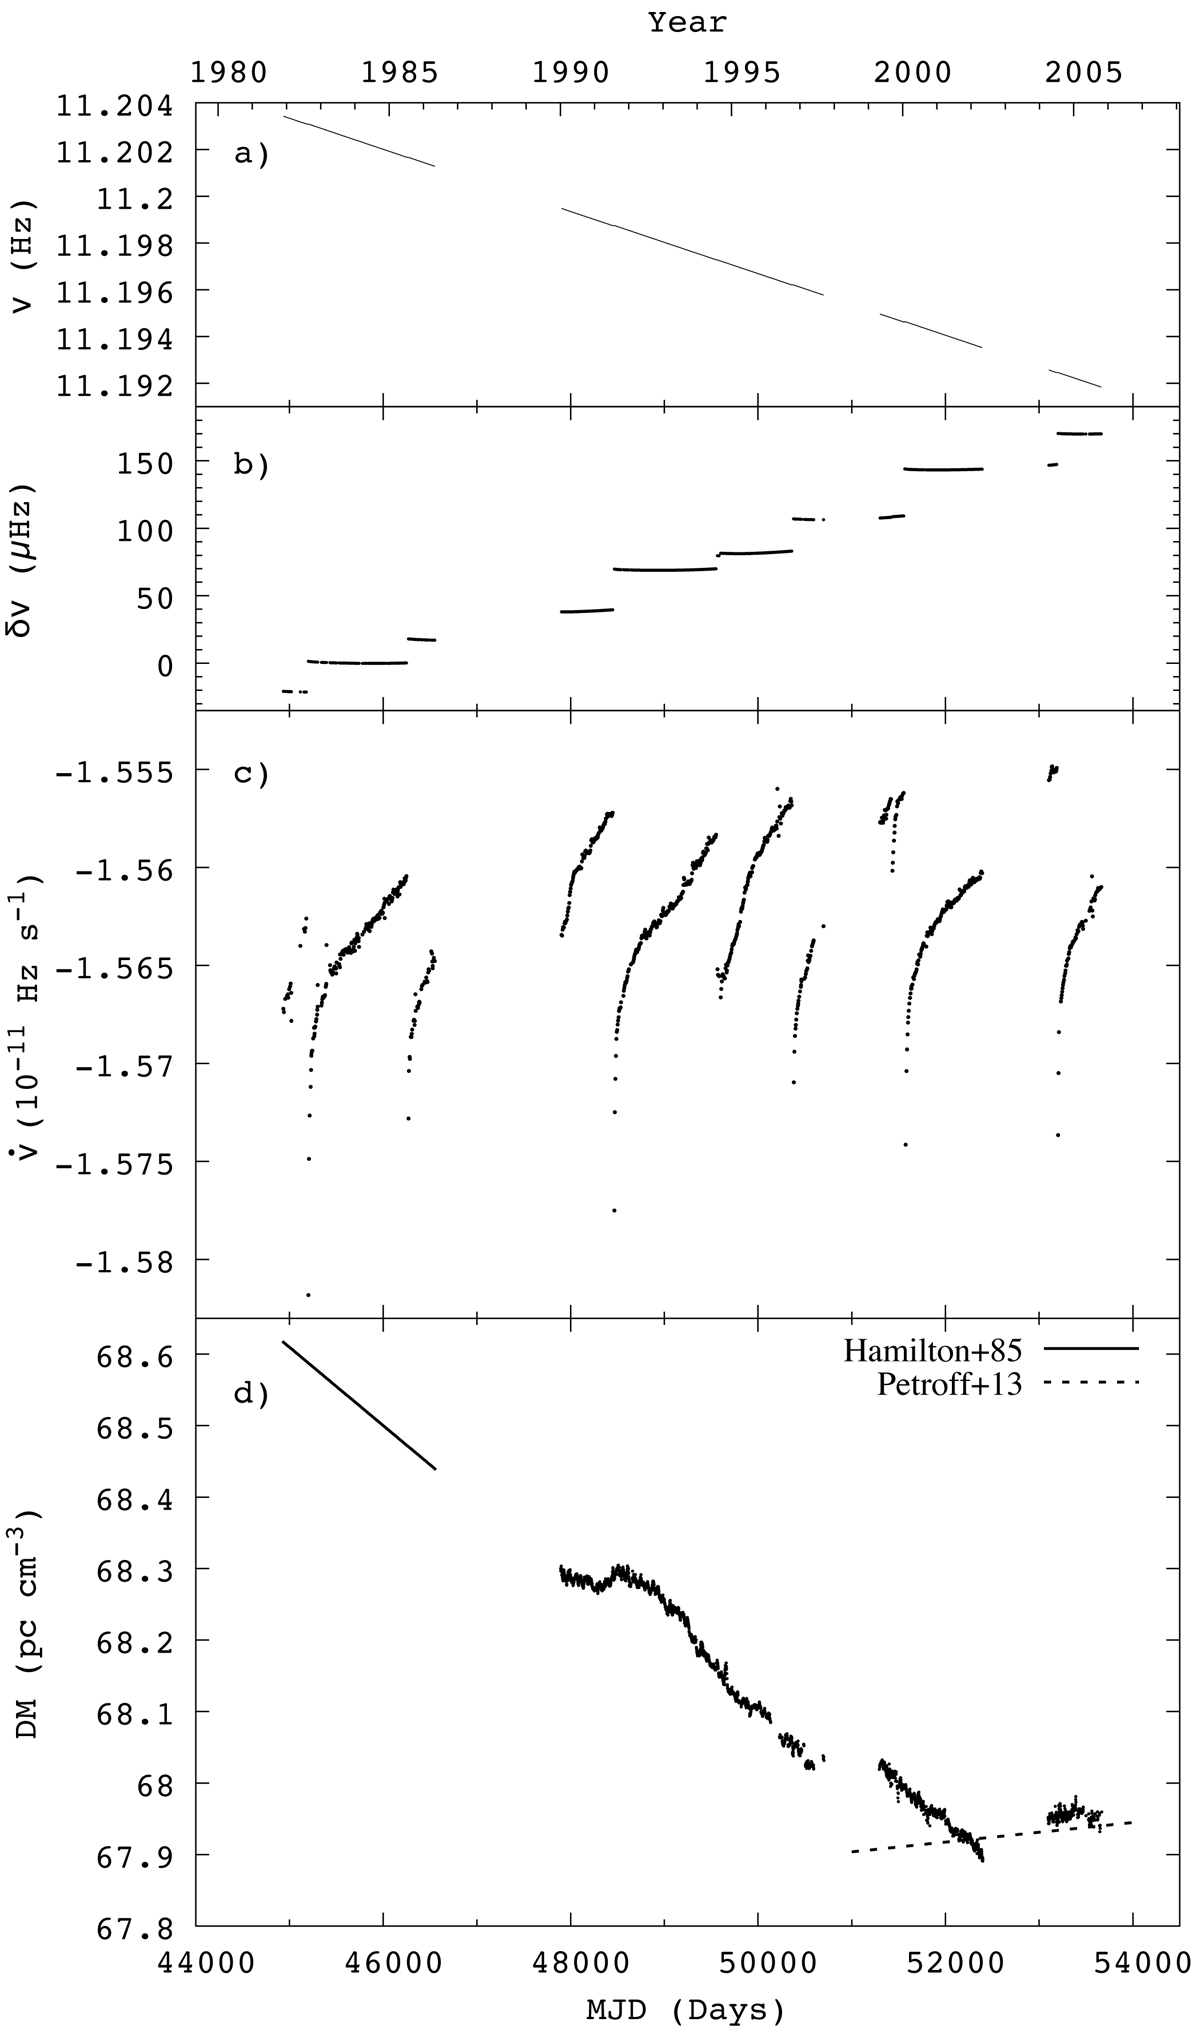
Fig. 1.

Mount Pleasant observations of the Vela pulsar between 1981 and 2005. (a) The evolution of the spin frequency ν. (b) Frequency residuals relative to a linear model for the 700 d of data before the second glitch (MJD 46257). (c) The evolution of the spin-down rate ![]() . Both ν and
. Both ν and ![]() were obtained from fits of a simple slow-down model to TOAs in a moving window covering 20 days, and moving by 5 d each stride. (d) Daily DM measurements. The solid line is the DM model we use for the data obtained in the 1980s. The segmented line is an extrapolation backward from a DM model adjusted to data after MJD 54 000.
were obtained from fits of a simple slow-down model to TOAs in a moving window covering 20 days, and moving by 5 d each stride. (d) Daily DM measurements. The solid line is the DM model we use for the data obtained in the 1980s. The segmented line is an extrapolation backward from a DM model adjusted to data after MJD 54 000.
Current usage metrics show cumulative count of Article Views (full-text article views including HTML views, PDF and ePub downloads, according to the available data) and Abstracts Views on Vision4Press platform.
Data correspond to usage on the plateform after 2015. The current usage metrics is available 48-96 hours after online publication and is updated daily on week days.
Initial download of the metrics may take a while.


